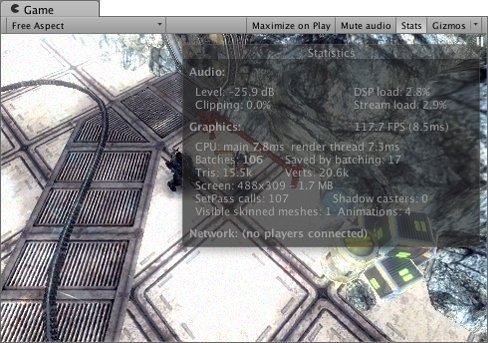
Rendering Statistics Window
The Game View has a Stats button in the top right corner. When the button is pressed, an overlay window is displayed which shows realtime rendering statistics, which are useful for optimizing performance. The exact statistics displayed vary according to the build target.

The Statistics window contains the following information:-
| Time per frame and FPS | The amount of time taken to process and render one game frame (and its reciprocal, frames per second). Note that this number only includes the time taken to do the frame update and render the game view; it does not include the time taken in the editor to draw the scene view, inspector and other editor-only processing. |
| Batches | “Batching” is where the engine attempts to combine the rendering of multiple objects into a chunk of memory in order to reduce CPU overhead due to resources switching. |
| Saved by batching | Number of batches that was combined. To ensure good batching, you should share materials between different objects as often as possible. Changing rendering states will break up batches into groups with the same states. |
| Tris and Verts | The number of triangles and vertices drawn. This is mostly important when optimizing for low-end hardware |
| Screen | The size of the screen, along with its anti-aliasing level and memory usage. |
| SetPass | The number of rendering passes. Each pass requires Unity runtime to bind a new shader which may introduce CPU overhead. |
| Visible Skinned Meshes | The number of skinned meshes rendered. |
| Animations | The number of animations playing. |
See also the rendering section of the profiler window which provides a more verbose and complete version of these stats.
对文档有任何疑问,请移步至开发者社区提问,我们将尽快为您解答