Livestream page
Visualize your data in real time at critical moments like game launch and during promotions.
The Livestream page samples your AnalyticsA data platform that provides analytics for your Unity game. More info
See in Glossary data as it happens without any other data processing. Note that other areas of the Analytics Dashboard do not show data until processing is complete, introducing a delay of several hours. Livestream requires a Unity Plus or Pro subscription.
The Livestream page has these sections:
- Live Metrics
- Activity Map
- Top Country Metrics
- Top Custom Events
Live Metrics

The Live Metrics section shows charts of incoming metrics data. The numbers in the display show the current day’s cumulative totals (reset at midnight GMT). The chart portions show activity over the last 5 minutes, starting when you load the Livestream page.
| User Logins | The number of players who have started a new session. |
| New UsersUsers who played your game for the first time. More info See in Glossary |
The number of new players. |
| Verified IAP RevenueRevenue from verified IAP transactions. IAP verification is currently supported by the Apple App Store and the Google Play Store. More info See in Glossary |
Reported IAP revenue (after receipt verification is performed). |
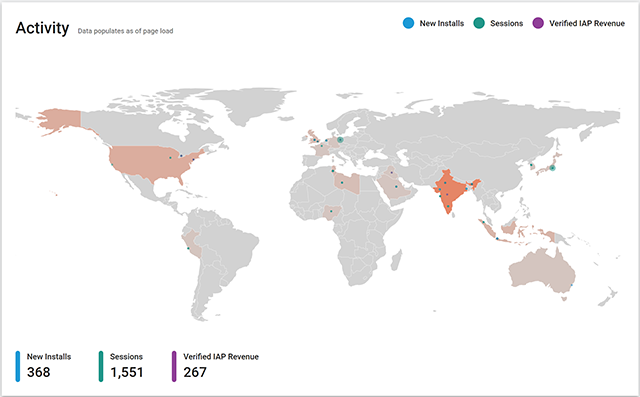
Activity Map

The Activity Map marks the geographic locations of incoming Analytics metrics events.
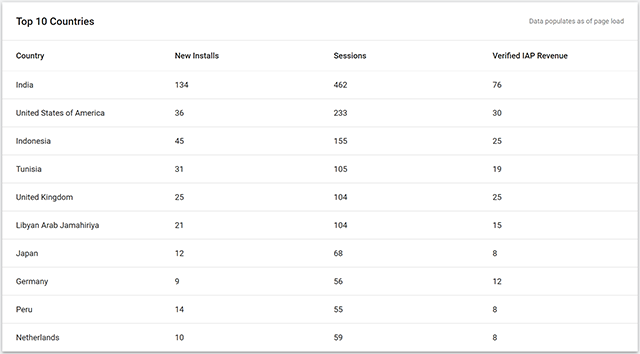
Top Country Metrics

The Top Country Metrics section shows metrics from the most active countries.
Top Custom Events

The Top Custom Events section shows the most common Standard and Custom EventsCustom events are freeform events that you can dispatch when an appropriate standard event is not available. Custom events can have any name and up to ten parameters. Use standard events in preference to custom events where possible. More info
See in Glossary dispatched while players use your game. The event counts are cumulative since you loaded the Livestream page.
Note that the events shown on the Livestream page are sampled for efficiency. This means that not every event is individually counted and, if you open Livestream in two different pages, the numbers and events shown can be slightly different.
- 2018–03–30 Page published with limited editorial review
- New feature in Unity 2017.1
- Added Top Country Metrics.