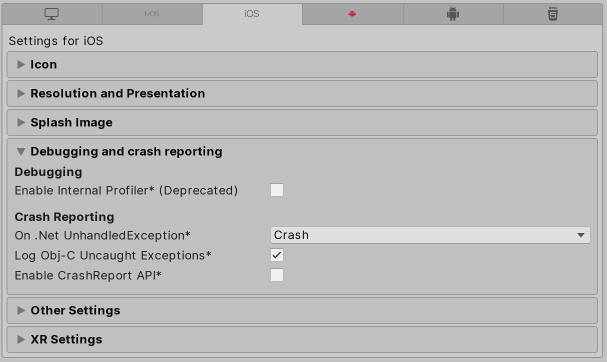
iOS Player settings - Debugging and crash reporting
Use the Debugging and crash reporting settings to gather data about your app’s performance and troubleshoot crashes.
| Setting | Function |
|---|---|
| Enable Internal Profiler (Deprecated) | This feature is deprecated and will be retired in a future version of Unity. Use the Profiler window instead (menu: Window > Analytics > Profiler). The Profiler collects application performance data and prints a report to the console. The report contains the number of milliseconds each Unity subsystem takes to execute on each frame, averaged across 30 frames. |
| On .Net UnhandledException | Select the action Unity takes when a .NET unhandled exception occurs. The options are Crash (the app crashes and generates a crash report, which users can submit to iTunes and developers can use to troubleshoot the crash), or Silent Exit (the application exits with no errors and doesn’t generate a crash report). |
| Log Obj-C Uncaught Exceptions | When you enable this action, Unity prints Objective-C Uncaught Exception information to the console. |
| Enable Crash Report API | Enables a custom crash reporter to capture crashes. You can use scriptsA piece of code that allows you to create your own Components, trigger game events, modify Component properties over time and respond to user input in any way you like. More info See in Glossary to access crash logs via the CrashReport API. |
Copyright © 2023 Unity Technologies
优美缔软件(上海)有限公司 版权所有
"Unity"、Unity 徽标及其他 Unity 商标是 Unity Technologies 或其附属机构在美国及其他地区的商标或注册商标。其他名称或品牌是其各自所有者的商标。
公安部备案号:
31010902002961