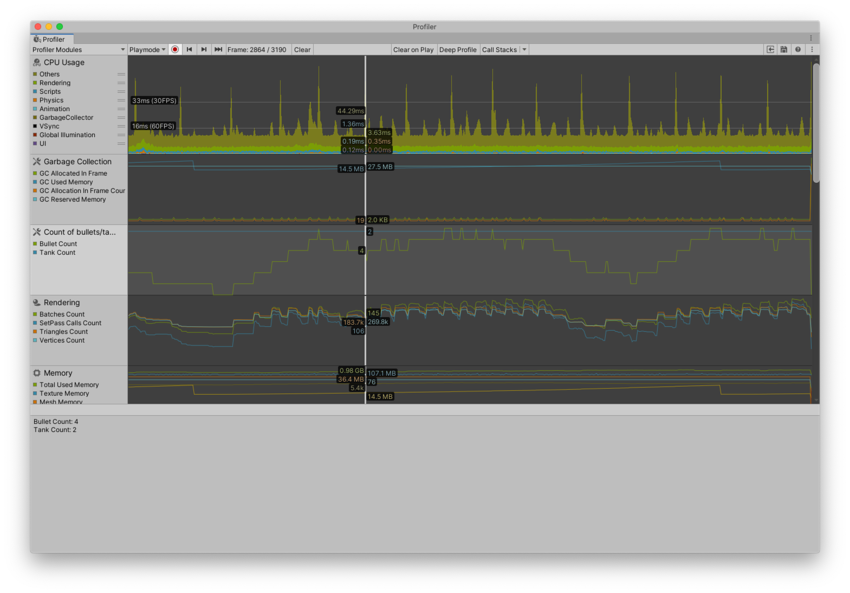
Profiler Module Editor
The ProfilerA window that helps you to optimize your game. It shows how much time is spent in the various areas of your game. For example, it can report the percentage of time spent rendering, animating, or in your game logic. More info
See in Glossary Module Editor is a tool that you can use to add your own custom modules to the Unity Profiler window. You can also add built-in counters to modules, or use the runtime API to add your own custom counters to modules. For information on how to implement your own counters, see the Profiling package documentation on Profiler Counters API.
It’s particularly useful when you need to hone in on statistics that you want to analyze deeper, or to add custom statistics about your application to the Profiler window.
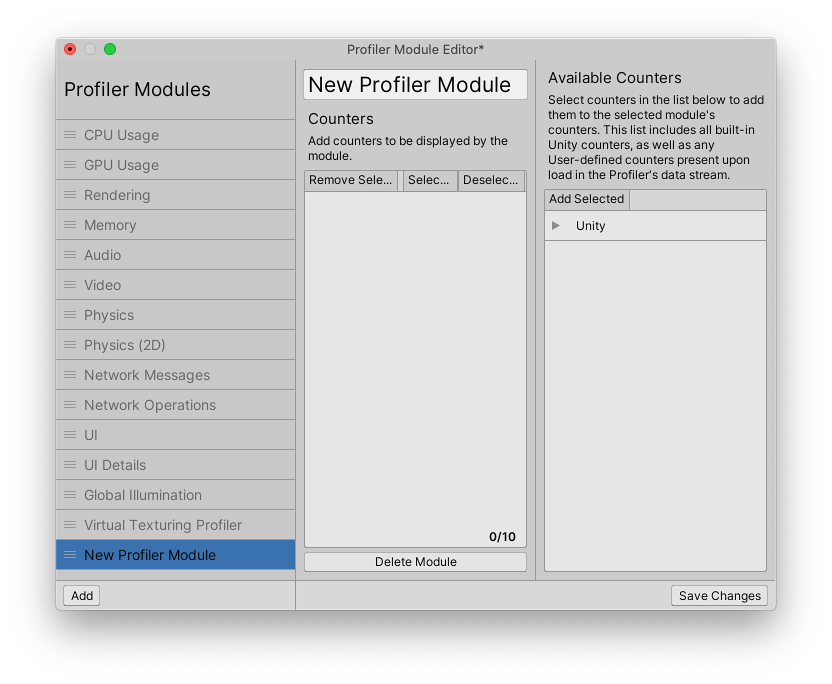
To use the Profiler Module Editor, open the Profiler Window (Window > Analysis > Profiler) and then select the Profiler Modules dropdown.
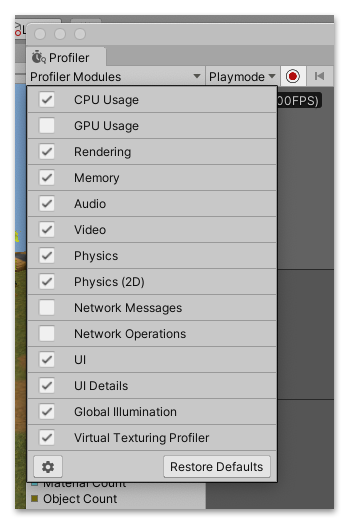
Select the gear icon, and the Profiler Module Editor window opens. The window has three columns:
- List of Profiler Modules: This list contains all of the available modules you can add to the Profiler Window. Built-in modules are greyed-out in the list, indicating that you cannot edit their contents. You can drag and drop the modules to reorder their appearance in the Profiler window. When you create your own custom Profiler Module, it also appears in this list.
- Profiler Module information pane (only appears when you create or select a custom module): Lists the counters contained in the custom module
- Available counters (only appears when you create or select a custom module): Lists the available counters you can add to the custom module.
Creating a custom module
To create a custom module, select the Add button in the bottom left of the Profiler Module Editor window. Unity adds a new Profiler module to the list called New Profiler Module. To rename the module, click in the text field and use your keyboard to set the name.
Adding counters to a module
To collect data in the custom Profiler module, you must add at least one counter for the module to track. You can add both built-in Unity counters, or use the ProfilerRecorder API to create your own counters to add to the module. The list of available counters appears in the Available Counters pane.
If you don’t have any data loaded into the Profiler window, then any counters you’ve created do not appear in the Available Counters pane when you load the Profiler Module Editor. To see your custom counters, you must capture or load some data that has your emitted counters in with the Profiler, and reopen the Profiler Module Editor.
The available Unity counters are divided into three areas: Memory, Render, and Virtual Texturing. For more information on the specific counters available in these areas, see the documentation for each module.
If you use the API to add your own counters, you must load or collect some data into the Profiler window first, and then your custom counters appear in the Available Counters pane under the User heading of the Profiler Module Editor.
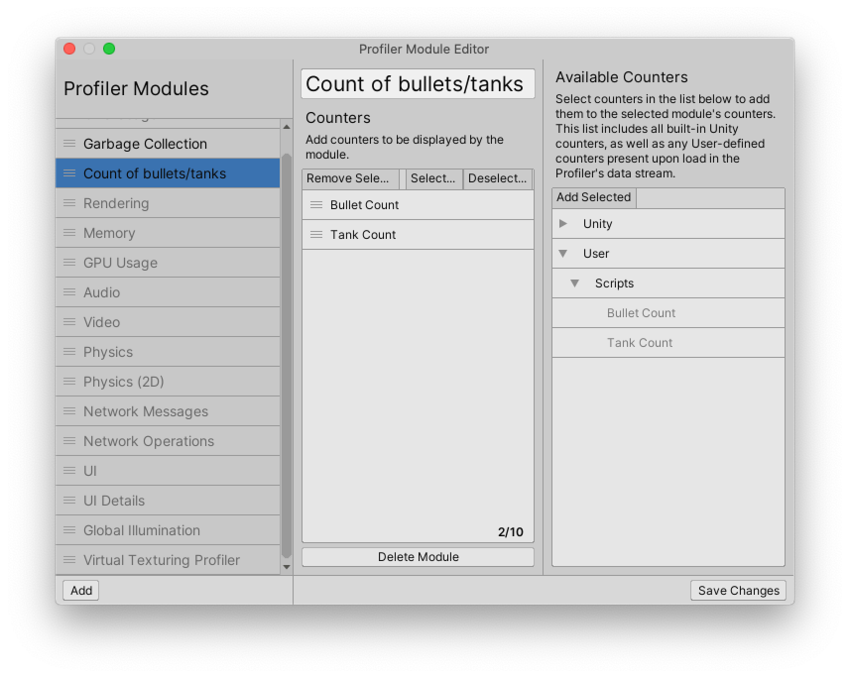
To add a counter to a module, select it in the Available Counters list and then select the Add Selected button. Alternatively, you can double-click a counter to add it to a module. Unity then adds these counters to the selected Profiler module. To add multiple counters to the module at once, you can hold down Shift and click two counters to select all the counters between the two, or you can hold down Ctrl (Command on macOS) to select counters one at a time, then select the Add Selected button.
To reorder the counters, you can drag and drop them. You can only add a maximum of 10 counters to a module.
Using custom modules
When you are happy with your custom module, select the Save Changes button in the bottom right corner of the Profiler Module Editor window. Unity closes the window, and you can then see your new module listed in the Profiler Window.
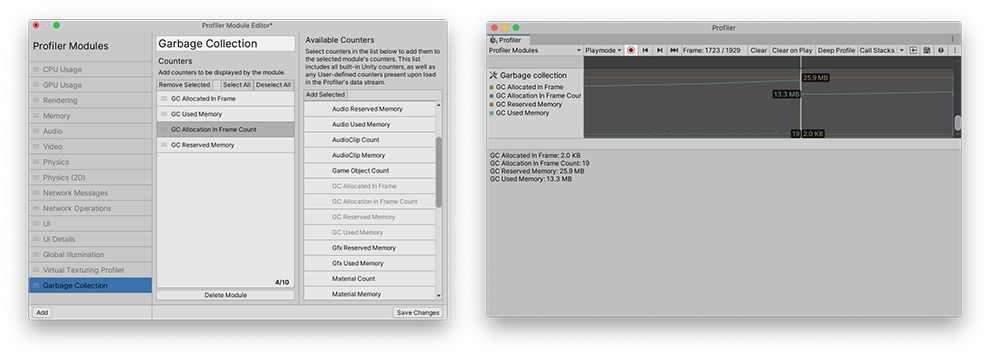
To effectively use and compare your data against the built-in modules, you can reorder the modules in the Profiler Window. To do this, open the Profiler Module Editor, and then drag and drop modules in the Profiler Modules pane.
This is particularly useful if you want to inspect custom elements of your application against spikes in the built-in Profiler data.
