FrameTimingManager
The FrameTimingManager is an API that captures detailed timing data about performance during individual frames in an application. You can use this data to assess those frames to understand why your application doesn’t meet performance targets.
Use the FrameTimingManager if:
- You need to debug at a frame-by-frame level.
- You want to use the Dynamic ResolutionA Camera setting that allows you to dynamically scale individual render targets, to reduce workload on the GPU. More info
See in Glossary feature. - You want to use the Adaptive Performance package.
Frame timings don’t replace data from the ProfilerA window that helps you to optimize your game. It shows how much time is spent in the various areas of your game. For example, it can report the percentage of time spent rendering, animating, or in your game logic. More info
See in Glossary; after you profile your application at a high level, use the FrameTimingManager to investigate specific details. The FrameTimingManager decreases performance when it records data, so it can’t produce an accurate measurement of how your application performs.
How to enable the FrameTimingManager
Tip: FrameTimingManager is always active for Development Player builds.
To enable the FrameTimingManage for Release builds and in the Unity Editor:
- Go to Edit > Project Settings > Player.
- In Other Settings, navigate to the Rendering heading.
- Enable the Frame Timing Stats property.
If you use the OpenGL platform, you also need to enable the OpenGL: Profiler GPU Recorders property to measure GPU usage. To do this:
- Go to Edit > Project > Settings > Player.
- In Other Settings, navigate to the Rendering heading.
- Enable the OpenGL: Profiler GPU property.
Note: In Unity versions 2021.2 and earlier, the OpenGL Profiler GPU Recorder disables the Frame Timing Stats property, so you can’t use them together.
How to use the FrameTimingManager
To access data that the FrameTimingManager records, use one of the following methods:
- View frame time data in a Custom Profiler module.
- Retrieve timestamp data from the FrameTimingManager C# API.
- Record data through specific profiler counters.
View frame time data with a Custom Profiler module
To view frame timing data in a Custom Profiler module:
- Create a custom profiler module according to the instructions on Creating a custom profiler module.
- In the Profiler Module Editor window, select your custom module.
- In the Available Counters panel, select Unity.
- Select Render to open the submenu that contains profiler countersPlaced in code with the ProfilerCounter API to track metrics, such as the number of enemies spawned in your game. More info
See in Glossary related to memory usage, which includes those that the FrameTimingStats property enables. You can then click on the relevant counters in the submenu to add them to your custom module.
The following table describes the purpose of each of the counters that become available when you enable Frame Timing Stats:
| Measurement | Description |
|---|---|
| CPU Total Frame Time (ms) | The total CPU frame time, in milliseconds. Unity calculates this as the time between the ends of two frames, including any overheads or time spent waiting in between frames. |
| CPU Main Thread Frame Time (ms) | The time between the start of the frame and the time when the Main Thread finished the work it performed during that frame, in milliseconds. |
| CPU Main Thread Present Wait Time (ms) | The CPU time spent waiting for Present() during the frame. |
| CPU Render Thread Frame Time (ms) | The time between the start of the work on the Render Thread and when Unity calls the Present() function, in milliseconds. |
| GPU Frame Time (ms) | The time difference between the beginning and the end of the GPU rendering a single frame, in milliseconds. |
Retrieve timestamp data from the FrameTimingManager C# API
Use the FrameTimingManager API to access timestamp information. In each variable, the FrameTimingManager records the time a specific event happens during a frame.
The following table shows the values available through the API, in the order that Unity executes them during a frame:
| Property | Description |
|---|---|
| frameStartTimestamp | The CPU clock time when the frame begins. |
| firstSubmitTimestamp | The CPU clock time when Unity submits the first job to the GPU during this frame. |
| cpuTimePresentCalled | The CPU clock time when Unity calls the Present() function for the current frame. |
| cpuTimeFrameComplete | The CPU clock time when the GPU finishes rendering the frame and interrupts the CPU. |
Record data with specific profiler counters
You can read FrameTimingManager values using the ProfilerRecorder API instead of the FrameTimingManager C# API. The benefit of this is that when you use the ProfilerRecorder API, the FrameTimingManager only records values when you attach a recorder to a specific counter. This behavior enables you to control which counters collect data and so, reduce the impact that the FrameTimingManager has on performance.
The following example shows how to track only the CPU Main Thread Frame Time variable with the ProfilerRecordAPI:
using Unity.Profiling;

using UnityEngine;

public class ExampleScript : MonoBehaviour

{

    string statsText;

    ProfilerRecorder mainThreadTimeRecorder;

    void OnEnable()

    {
        mainThreadTimeRecorder = ProfilerRecorder.StartNew(ProfilerCategory.Internal, "CPU Main Thread Frame Time");
    }

    void OnDisable()

    {
        mainThreadTimeRecorder.Dispose();
    }

    void Update()

    {

        var frameTime = mainThreadTimeRecorder.LastValue;

        // Your code logic here

    }
}
How the FrameTimingManager works
The FrameTimingManager provides results with a set delay of four frames. This is because timing results aren’t immediately available at the end of each frame, so the FrameTimingManager waits to get CPU and GPU data for the frame.
The delay doesn’t guarantee accurate timing results, because the GPU may not have any available resources to return the results, or might fail to return them correctly.
The FrameTimingManger changes how it produces a FrameTimeComplete timestamp under some circumstances:
- If the GPU supports GPU timestamps, the GPU provides a FrameTimeComplete timestamp.
- If the GPU doesn’t support GPU timestamps and returns GPU Time, the FrameTimingManager calculates a value for gpuFrameTime. The value is the sum of the reported GPU Time and the FirstSubmitTimestamp values.
- If the GPU doesn’t support GPU timestamps and doesn’t return GPU Time,the FrameTimingManager sets the value of PresentTimestamp as the value of FrameTimeComplete.
Possible inaccuracy with tile-based deferred rendering GPUs
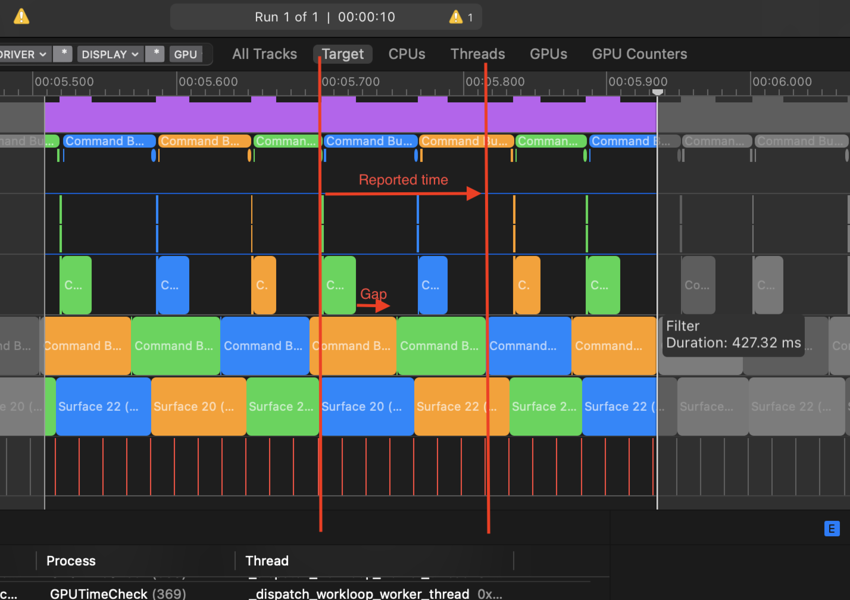
For GPUs that use tile-based deferred rendering architecture, such as Metal GPUs in Apple devices, the reported GPU Time might be larger than the reported frame time.
This can happen when the GPU is under heavy load, or when the GPU pipeline is full. In these cases, the GPU might defer execution of some rendering phases. Because the FrameTimingManager measures the time between the beginning and end of the frame rendering, any gaps between phases increase the reported GPU time.
In the example below, no GPU resources are available, because the GPU passes a job from the Vertex queue to the Fragment queue. The GPU’s graphics API therefore defers the execution of the next phase. When this happens, the GPU time measurement includes phase work time and any gap in between. The result is that the FrameTimingManager reports a higher GPU time measurement than expected.
Platform support
| Property | Description | Supported | Comment |
|---|---|---|---|
| Windows | DirectX 11 | Yes | |
| DirectX 12 | Yes | ||
| OpenGL | Yes | ||
| Vulkan | Yes | ||
| macOS | Metal | Yes | Might report a larger GPU time measurement than the total frame time due to the behavior of tile-based deferred rendering GPUs. |
| Linux | OpenGL | Partial | Doesn’t support the GPU time measurement. |
| Vulkan | Yes | ||
| Android | OpenGL ES | Yes | |
| Vulkan | Yes | ||
| iOS | Metal | Yes | Might report a larger GPU time measurement than the total frame time due to the behavior of tile-based deferred rendering GPUs. |
| tvOS | Metal | Yes | Might report a larger GPU time measurement than the total frame time due to the behavior of tile-based deferred rendering GPUs. |
| WebGLA JavaScript API that renders 2D and 3D graphics in a web browser. The Unity WebGL build option allows Unity to publish content as JavaScript programs which use HTML5 technologies and the WebGL rendering API to run Unity content in a web browser. More info See in Glossary |
WebGL | Partial | Doesn’t support the GPU time measurement. |
Additional resources
Copyright © 2023 Unity Technologies
优美缔软件(上海)有限公司 版权所有
"Unity"、Unity 徽标及其他 Unity 商标是 Unity Technologies 或其附属机构在美国及其他地区的商标或注册商标。其他名称或品牌是其各自所有者的商标。
公安部备案号:
31010902002961