Frame Debugger window reference
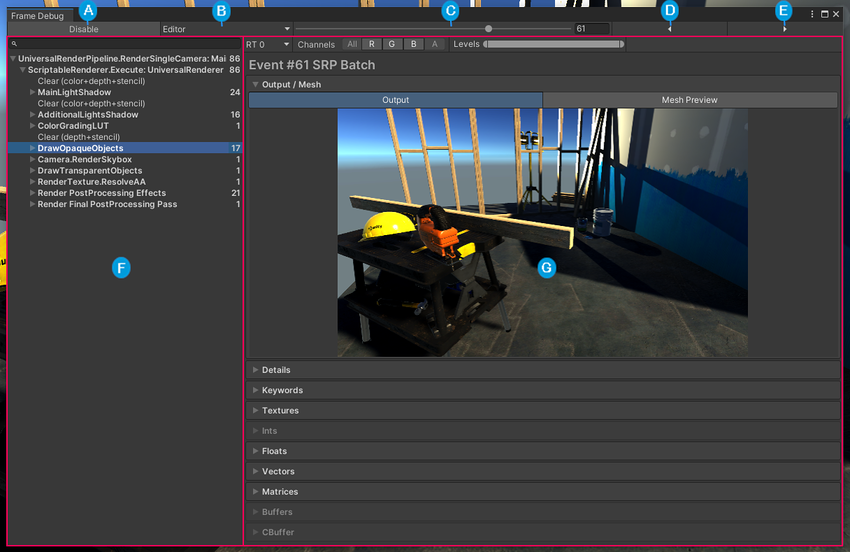
The Frame Debugger window is the user interface for Unity’s Frame Debugger. It shows the rendering event information and controls the playback of the frame under construction.

| Label | Description |
|---|---|
 |
Enable/Disable: Enables or disables the Frame Debugger. |
 |
Target selector: Specifies the process to attach the Frame Debugger to. This is the Unity Editor by default but you can use this to attach the Frame Debugger to built applications. For more information, see Attach the Frame Debugger to a built project. |
 |
Event scrubber: A slider you can use to move through the rendering events in the current frame linearly. |
 |
Previous event: Selects the event previous to the one currently selected. |
 |
Next event: Selects the event after the one currently selected. |
 |
Event Hierarchy: Lists the sequence of rendering events that constitute the frame. For more information, see Event Hierarchy. |
 |
Event Information Panel: Displays information about the event such as geometry details and the shaderA program that runs on the GPU. More info See in Glossary used for a draw call. For more information, see Event Information Panel. |
Debug a frame
To debug a frame using the Frame Debugger:
- Open the Frame Debugger (menu: Window > Analysis > Frame Debugger).
- Use the target selector to select the process to attach the Frame Debugger to. If you want to debug a frame in the Unity Editor, set this to Editor. If you want to debug a frame in a built application, see Attach the Frame Debugger to a built project.
- Click Enable. When you do this, the Frame Debugger captures a frame. It populates the Event Hierarchy with the draw calls and other events that constitute the frame and renders the frame in the Game view.
Note: If your application is running, the Frame Debugger pauses it. - Select an event from the Event Hierarchy to view the sceneA Scene contains the environments and menus of your game. Think of each unique Scene file as a unique level. In each Scene, you place your environments, obstacles, and decorations, essentially designing and building your game in pieces. More info
See in Glossary as it appears up to and including that event. This also displays information about the event in the Event Information Panel. You can use the previous event and next event button, the arrow keys, or the event scrubber to move through the frame linearly. If you don’t know which event Unity renders the geometry you want to debug in, these navigation tools are useful to move through the events linearly until you find it.
When a draw call event corresponds to the geometry of a GameObjectThe fundamental object in Unity scenes, which can represent characters, props, scenery, cameras, waypoints, and more. A GameObject’s functionality is defined by the Components attached to it. More info
See in Glossary, Unity highlights that GameObject in the Hierarchy.
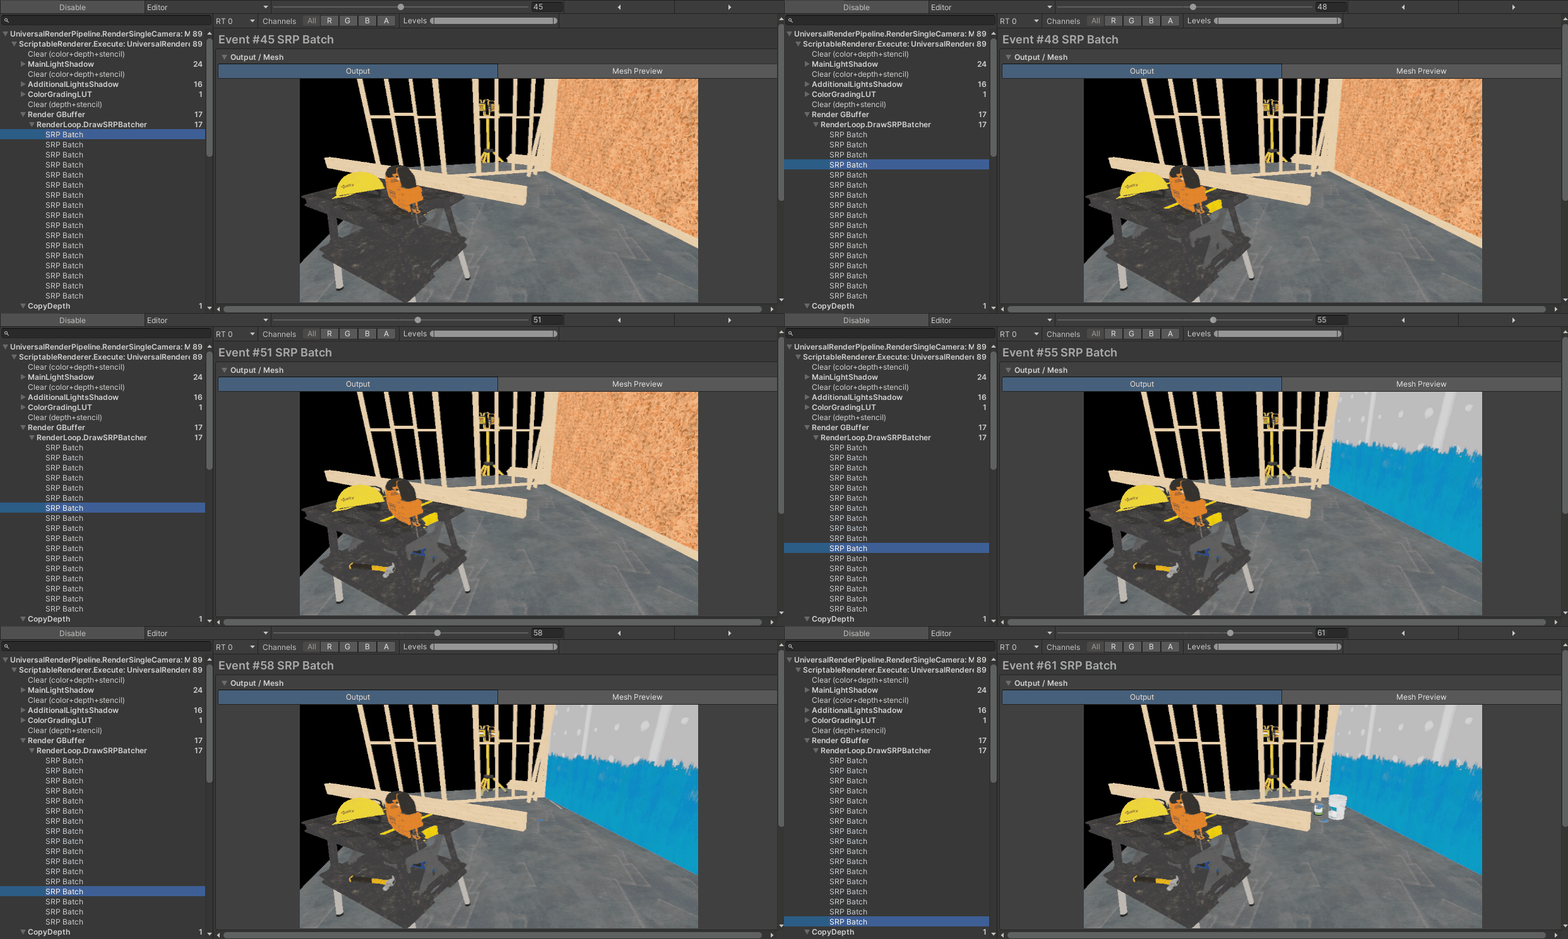
If an event renders into a RenderTexture, Unity displays the contents of that RenderTexture in the Game view and Frame Debugger window. This is useful for inspecting how various off-screen render targets build up. For example:

Attach the Frame Debugger to a built project
You can change the Frame Debugger’s target process to attach the Frame Debugger to a built Unity Player. To be compatible with the Frame Debugger, the Unity Player must:
- Use the Development BuildA development build includes debug symbols and enables the Profiler. More info
See in Glossary Build Setting. - Support multithreaded rendering. Every Unity platform except WebGLA JavaScript API that renders 2D and 3D graphics in a web browser. The Unity WebGL build option allows Unity to publish content as JavaScript programs which use HTML5 technologies and the WebGL rendering API to run Unity content in a web browser. More info
See in Glossary supports this. - For desktop platforms, use the Run In Background Player Setting. Otherwise, when you focus the Frame Debugger window in the Unity Editor, the Unity Player loses focus and doesn’t reflect any rendering changes.
If the Unity Player fulfills the above requirements, when you next debug a frame, you can attach the Frame Debugger to the Unity Player.