////WIP
Debugging
The "Input Debugger" view provides a window into the data and activity of the input system. To open the window, go to Window >> Analysis >> Input Debugger in Unity's main menu in the editor.
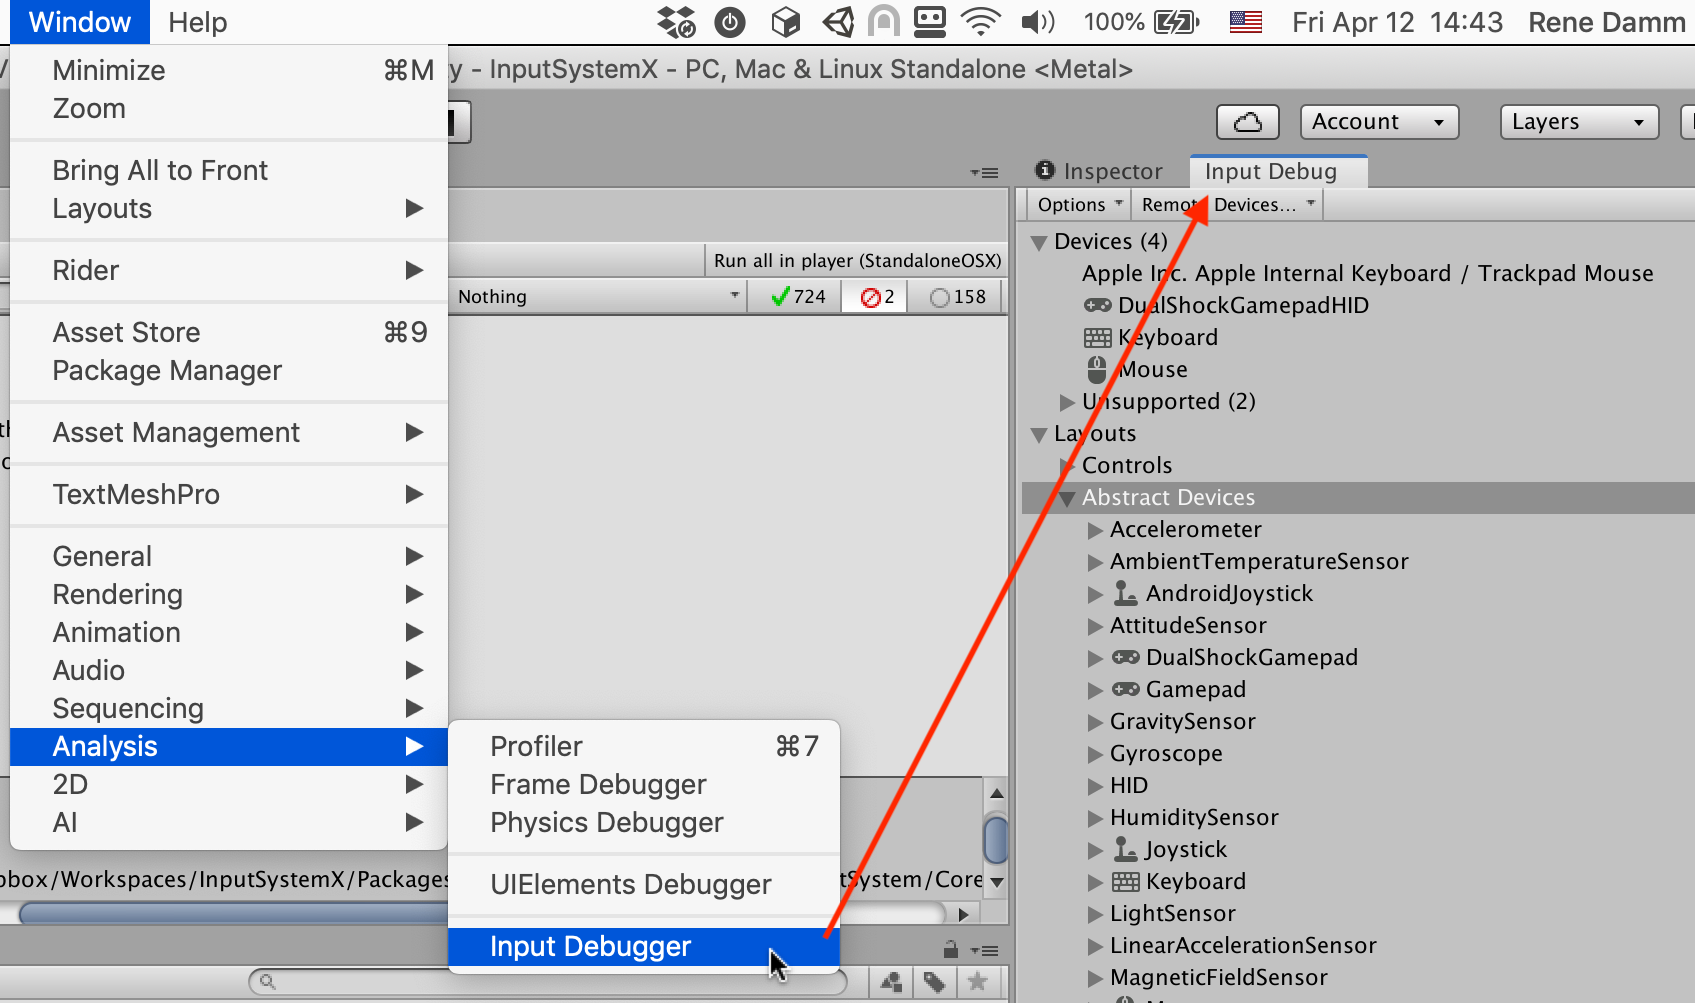
The debugger shows a tree breakdown of the state of the input system.
| Item | Description |
|---|---|
| Devices | Input devices that are currently added to the system as well as a list of unsupported/unrecognized devices. |
| Layouts | |
| Actions | Only visible in play mode and only if there are actions that are currently enabled. Shows the list of all currently enabled actions and the controls they are bound to. |
| Users | Only visible when there is one or more InputUser instances. See documentation.Lists all currently active uers along with their active control schemes and devices, all their associated actions as well as the controls they are bound to. Note that PlayerInput uses InputUser underneath. This means that when using PlayerInput components, each player will have an entry here. |
| Settings | |
| Metrics |
Connecting a Player
NOTE: At the moment, debugging input in players is restricted to seeing devices and events from connected players. There is no support yet for seeing other input-related data from players.
////TODO: explain "Remote Devices"