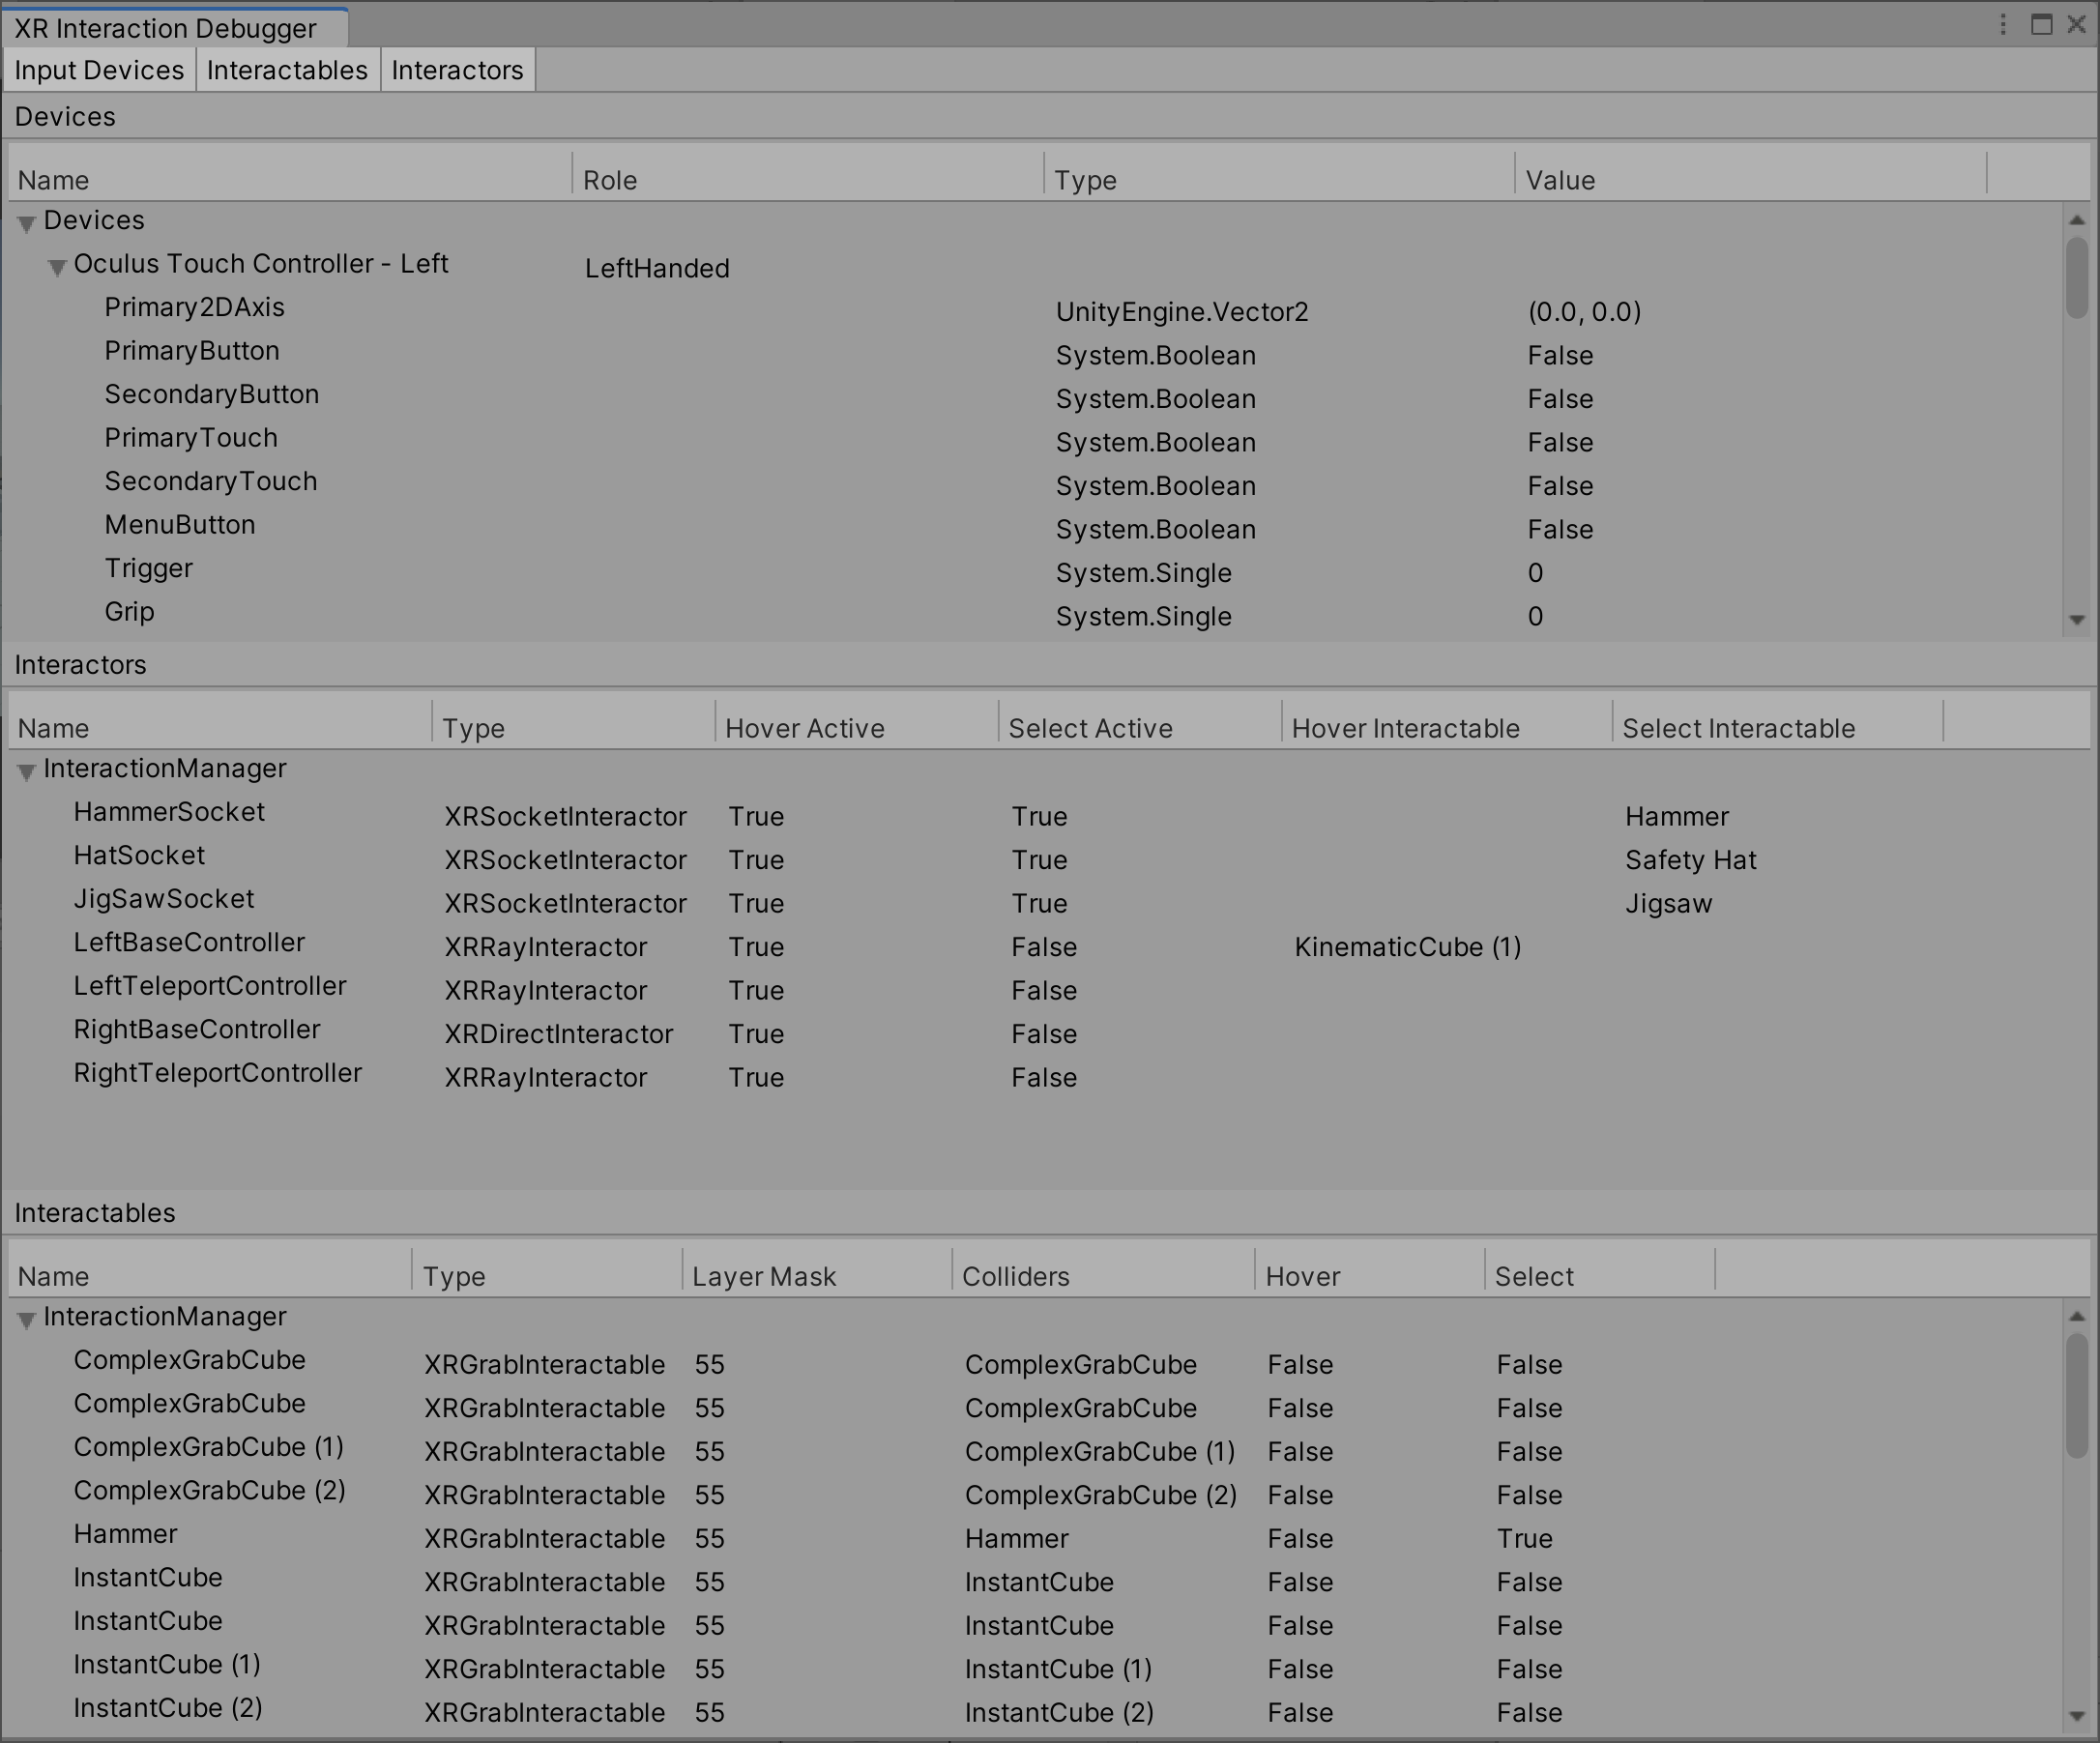
Debugger window
The XR Interaction Toolkit Debugger window displays a top-down view of all the Input Devices, Interactables, and Interactors in a scene. It also displays their relationship to each other and their parent Interaction Managers. To open this window, go to Window > Analysis > XR Interaction Debugger from Unity's main menu.
You must be in Play mode to use this window.
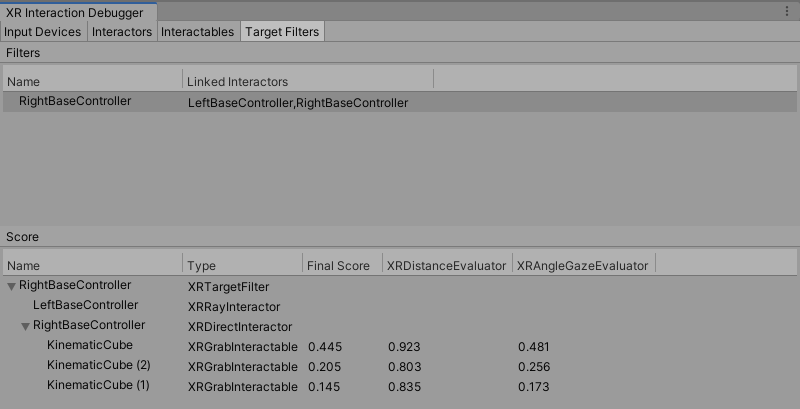
Target filters
The Target Filters tab displays all active and enabled XRTargetFilters in the scene. It also displays the Interactors and XRTargetFilters that are linked at the moment.
You can select an XRTargetFilter in the Filters tree to inspect its Evaluators' scores in the Score tree. The Score tree displays the final and weighted scores for an Interactable in a Valid Target list. The Interactors are shown as the parent of their respective Valid Target list.