Analyzing profiler traces
When you profile your application, there are some common issues that you might come across. This page outlines how to investigate the cause of some common performance issues.
Dissecting startup traces
When looking at a trace of start-up times, there are two key methods to inspect: UnityInitApplicationGraphics and UnityLoadApplication. These two methods are the primary places where the configuration, assets, and code of a project can impact start-up time.
Note: The start-up time of your application differs from platform to platform. On most platforms, start up happens while the splash screen appears.
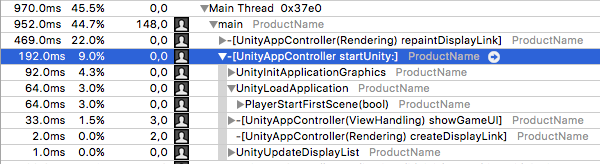
In the above screenshot from an Instruments trace of an example Unity project running on an iOSApple’s mobile operating system. More info
See in Glossary device, in the platform-specific startUnity method, note the UnityInitApplicationGraphics and UnityLoadApplication methods.
UnityInitApplicationGraphics performs a lot of internal work, such as setting up the graphics device and initializing a lot of Unity’s internal systems. It also initializes the Resources system by loading an index of all the files contained in the Resources system.
Unity’s Resource system includes every asset file in its data that’s in the Resources folder in the Assets folder of your project. This includes any files in the Resources folder’s children folders. As such, the time required to initialize the Resources system increases in correlation with the number of files within the Resources folders in your application’s project.
UnityLoadApplication contains methods that load and initialize the first SceneA Scene contains the environments and menus of your game. Think of each unique Scene file as a unique level. In each Scene, you place your environments, obstacles, and decorations, essentially designing and building your game in pieces. More info
See in Glossary in the project. This includes deserializing and instantiating the data necessary to display the first Scene, such as compiling ShadersA program that runs on the GPU. More info
See in Glossary, uploading Textures and instantiating GameObjectsThe fundamental object in Unity scenes, which can represent characters, props, scenery, cameras, waypoints, and more. A GameObject’s functionality is defined by the Components attached to it. More info
See in Glossary. Also, Unity executes the Awake callbacks of all MonoBehaviours in the first Scene.
These processes mean that if there is any long-running code in an Awake callback in the first Scene of a project, that code could be responsible for slowing down the project’s initial start-up time. Resolving this involves either eliminating the slow code, or executing it elsewhere in the application’s lifecycle.
Dissecting run time traces
For profiling traces captured after the initial startup time, the primary place of interest is the method PlayerLoop. This is Unity’s main loop, and the code within it runs once per frame.
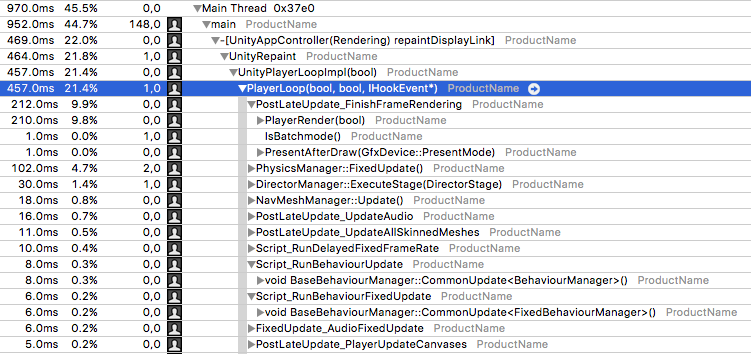
The above screenshot illustrates several of the most performance-impacting methods within PlayerLoop. Note: The names of methods within the PlayerLoop might vary between Unity versions.
PlayerRender is the method that runs Unity’s renderingThe process of drawing graphics to the screen (or to a render texture). By default, the main camera in Unity renders its view to the screen. More info
See in Glossary system. This includes culling objects, calculating dynamic batches, and submitting drawing instructions to the GPU. Any Image Effects or rendering-based script callbacks (OnWillRenderObject, for example) also run here. In general, this should be the top consumer of CPU time while the project is interactive.
BaseBehaviourManager calls three templated versions of CommonUpdate. These invoke certain callbacks within the MonoBehaviours attached to active GameObjects in the current Scene:
-
CommonUpdate<UpdateManager>callsUpdatecallbacks -
CommonUpdate<LateUpdateManager>callsLateUpdatecallbacks -
CommonUpdate<FixedUpdateManager>callsFixedUpdateif the physics system has ticked
In general, BaseBehaviourManager::CommonUpdate<UpdateManager> is the most useful method family to inspect, because it’s the entry point for most of the script code running within a Unity project.
There are several other methods that are useful to inspect:
-
UI::CanvasManagerinvokes several different callbacks if a project uses the UGUI system. This includes Unity UI(User Interface) Allows a user to interact with your application. More info
See in Glossary’s batch computation and layout updates; the two operations that most often causeCanvasManagerto appear in the ProfilerA window that helps you to optimize your game. It shows how much time is spent in the various areas of your game. For example, it can report the percentage of time spent rendering, animating, or in your game logic. More info
See in Glossary. -
DelayedCallManager::Updateruns coroutines. -
PhysicsManager::FixedUpdateruns the PhysX physics system. This primarily involves running PhysX’s internal code. The number of physics objects in the current Scene, such asRigidbodyandColliderinfluence PhysX’s internal code. Physics-based callbacks also appear here: in particular,OnTriggerStayandOnCollisionStay.
If the project is using 2D physics, that appears as a similar set of calls under Physics2DManager::FixedUpdate.
Dissecting a script method
When scriptsA piece of code that allows you to create your own Components, trigger game events, modify Component properties over time and respond to user input in any way you like. More info
See in Glossary are invoked on platforms cross-compiled with IL2CPPA Unity-developed scripting back-end which you can use as an alternative to Mono when building projects for some platforms. More info
See in Glossary, look for trace lines that contain a ScriptingInvocation object. This is the point where Unity’s internal native code transitions into the script runtime to execute script code. Note: Technically, after Unity runs your C# code through IL2CPP, it also becomes native code. However, this cross-compiled code primarily executes methods via the IL2CPP runtime framework and doesn’t resemble handwritten C++.
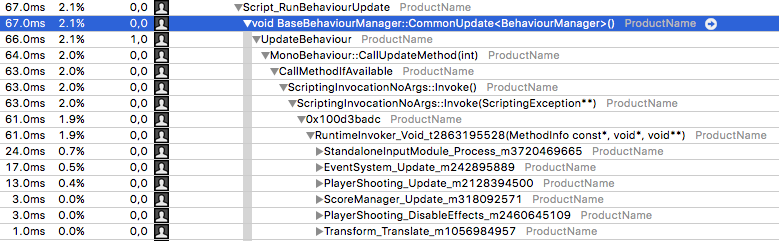
In the above screenshot, the methods nested beneath the RuntimeInvoker_Void line are part of cross-compiled C# scripts that Unity executed once per frame.
The trace lines’ names are the name of the original class followed by an underscore and the name of the original method. In this example trace, you can see EventSystem.Update, PlayerShooting.Update and several other Update methods. These are the standard Unity Update callbacks found in most MonoBehaviours.
You can expand these methods to see which methods within them consumed CPU time. This includes other script methods within the project, Unity APIs, and C# library code.
The above trace shows that the StandaloneInputModule.Process method was ray casting through the entire UI once per frame. This method detects whether any touch events were hovering over, or activating any UI elements. The method iterating over all the UI elements, and testing whether the mouse’s position is within their bounding rectangle is resource-intensive.
Asset loading
You can also identify asset loading in CPU traces. The main method that indicates an Asset load is SerializedFile::ReadObject. This method connects a binary data stream from a file to Unity’s serialization system, which operates via a method named Transfer. The Transfer method is on all Asset types, such as Textures, MonoBehaviours and Particle SystemsA component that simulates fluid entities such as liquids, clouds and flames by generating and animating large numbers of small 2D images in the scene. More info
See in Glossary.
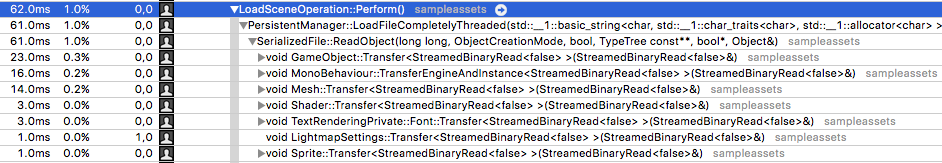
The above screenshot is a trace of Unity loading a Scene. When it loads a Scene, Unity reads and deserializes all the Assets within the Scene, as denoted by the calls to various Transfer methods beneath SerializedFile::ReadObject.
If you see a performance stutter during runtime and the performance trace shows that SerializedFile::ReadObject used a significant amount of time, it means that Asset loads reduced the frame rate. Note: SerializedFile::ReadObject usually appears on the main thread when the SceneManager, Resources or AssetBundle APIs request synchronous Asset loads.
To resolve this performance stutter can you can make Asset loading asynchronous (which moves the heavy ReadObject call to a worker thread), or preload certain heavy Assets.
Transfer calls also appear when Unity clones objects (denoted by the CloneObject method in a trace). If a call to Transfer appears beneath a CloneObject call, then Unity isn’t loading the Asset from storage. Instead, Unity transfers the old object’s data to the new object. To do this, Unity serializes the old object and deserializes the resulting data as the new object.
Copyright © 2023 Unity Technologies
优美缔软件(上海)有限公司 版权所有
"Unity"、Unity 徽标及其他 Unity 商标是 Unity Technologies 或其附属机构在美国及其他地区的商标或注册商标。其他名称或品牌是其各自所有者的商标。
公安部备案号:
31010902002961