Creating Custom Profiler modules
A custom ProfilerA window that helps you to optimize your game. It shows how much time is spent in the various areas of your game. For example, it can report the percentage of time spent rendering, animating, or in your game logic. More info
See in Glossary module displays performance data from your system in the Profiler window.
You can create a custom profiler module in one of the following ways:
Some packages include custom profiler modules that you can use when you install that specific package. For more information, see the Profiler modules list.
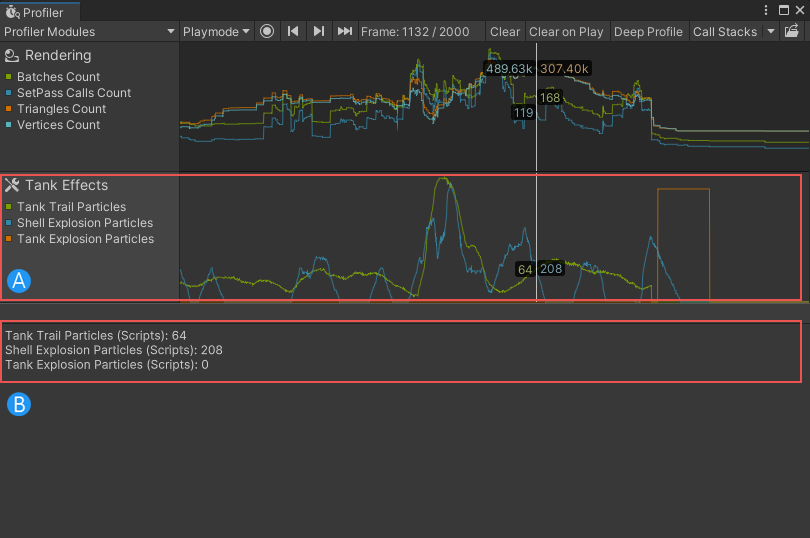
A custom module displays the counters you specified in code in the Profiler window chart view (A), and the counters appear as a list in the module details panel (B).

Creating custom Profiler modules using the Profiler Module Editor
You can use Unity’s built-in Profiler Module Editor to create a custom Profiler module. For more information, see the Profiler Module Editor documentation section Creating a custom module.
Creating Custom Profiler modules in code
To create a custom Profiler module via code, you must create a new ProfilerModule script and define the module’s properties including the counters it displays, its name, and its icon.
To define a custom Profiler module, your script must do the following:
- Define a class derived from ProfilerModule in your project or package. In the following example, the class is called
TankEffectsProfilerModule:
public class TankEffectsProfilerModule : ProfilerModule
- Assign the ProfilerModuleMetadata attribute to this class and specify the module’s display name in the attribute’s argument. In the following example, the display name is “Tank Effects”:
[ProfilerModuleMetadata("Tank Effects")]
- Implement a constructor that has no parameter, and pass a list of chart counter descriptions to the base constructor. In the following example, the constructor with no parameter is
TankEffectsProfilerModule(), the list of chart counter descriptors isk_Counters, and the base constructor isbase:
static readonly ProfilerCounterDescriptor[] k_Counters = new ProfilerCounterDescriptor[]
{
    new ProfilerCounterDescriptor(GameStatistics.TankTrailParticleCountName, GameStatistics.TanksCategory),
    new ProfilerCounterDescriptor(GameStatistics.ShellExplosionParticleCountName, GameStatistics.TanksCategory),
    new ProfilerCounterDescriptor(GameStatistics.TankExplosionParticleCountName, GameStatistics.TanksCategory),
};

public TankEffectsProfilerModule() : base(k_Counters) { }
Displaying a custom Profile module in the Profiler window
When you define a custom Profiler module, the Profiler window automatically detects it. To view data in your custom Profiler module in the Profiler window:
- Connect the Profiler to your application. For more information, see Profiling your application.
- Run your application.
You can also run the Profiler when your application is in Play mode. However, if you profile an application in Play mode, the Profiler displays data that is not representative of how your application runs when you build it on a hardware device.