Customizing the Profiler
You can customize the Unity ProfilerA window that helps you to optimize your game. It shows how much time is spent in the various areas of your game. For example, it can report the percentage of time spent rendering, animating, or in your game logic. More info
See in Glossary to capture and visualize specific performance data in your application. This performance data provides information about key performance characteristics, which you can use for optimization or for making tooling decisions.
You can use the Profiler Module Editor to add custom modules without hand-writing any code. The Profiler Module Editor is Unity’s built-in UI(User Interface) Allows a user to interact with your application. Unity currently supports three UI systems. More info
See in Glossary for Profiler customization. For more information, see Profiler Module Editor.
For more control, you can also use code to customize the Profiler in the following ways:
- You can add Profiler counters to your code to tell the Profiler to collect specific custom data.
- You can use Profiler countersPlaced in code with the ProfilerCounter API to track metrics, such as the number of enemies spawned in your game. More info
See in Glossary to create a custom Profiler module in the Profiler Window. - You can Customize a module window further with visualizations in the module details panel.
To customize the profiler using code, you need to install the Unity Profiling Core package.
Using profiler markers to visualize code
You can use profiler markersPlaced in code to describe a CPU or GPU event that is then displayed in the Unity Profiler window. Added to Unity code by default, or you can use ProfilerMarker API to add your own custom markers. More info
See in Glossary to visualize resource-intensive blocks of code in the Profiler window.
Profiler Markers allow you to view method calls that Unity does not profile by default. You can then display these method calls in the CPU Profiler module without the need to use Deep Profiling. For more information, see the ProfilerMarker API guide.
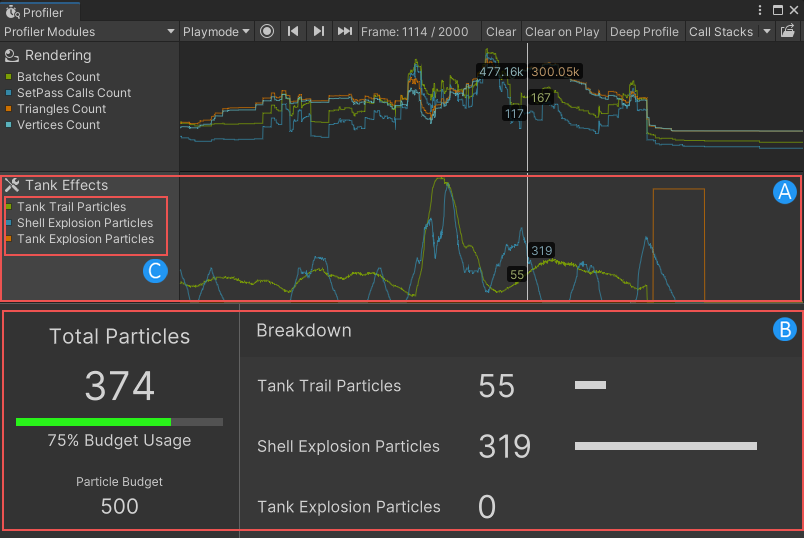
Example of a customized Profiler window
The following example image of a customized Profiler window contains:
a custom profiler module named Tank Effects (A).
a custom module details panel (B) that visualizes the data in the Tank Effects profiler module.
the following custom counters (C):
Tank Trail Particles
Shell Explosion Particles
Tank Explosion Particles
