Profiler overview

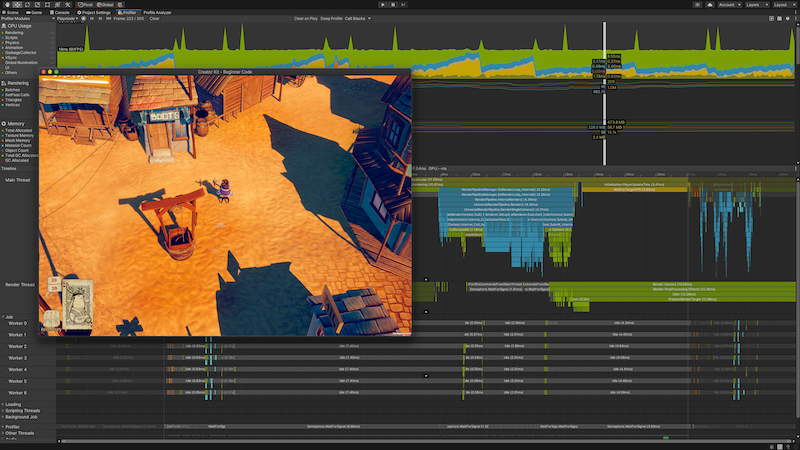
The Unity Profiler is a tool you can use to get performance information about your application. You can connect it to devices on your network or devices connected to your machine to test how your application runs on your intended release platform. You can also run it in the Editor to get an overview of resource allocation while you’re developing your application.
The Profiler gathers and displays data on the performance of your application in areas such as the CPU, memory, renderer, and audio. It’s a useful tool to identify areas for performance improvement in your application, and iterate on those areas. You can pinpoint things like how your code, assets, sceneA Scene contains the environments and menus of your game. Think of each unique Scene file as a unique level. In each Scene, you place your environments, obstacles, and decorations, essentially designing and building your game in pieces. More info
See in Glossary settings, cameraA component which creates an image of a particular viewpoint in your scene. The output is either drawn to the screen or captured as a texture. More info
See in Glossary rendering, and build settings affect your application’s performance. It displays the results in a series of charts, so you can visualize where spikes in your application’s performance happen.
In addition to using the built-in Unity Profiler, you can use the low level native plug-in Profiler API to export profiling data to third-party profiling tools, and the Profiling Core package to customize your profiling analysis. You can also add powerful profiling tools such as the Memory Profiler, and the Profile Analyzer to your project to analyze performance data in further detail.
To access the Profiler window go to menu: Window > Analysis > Profiler. For a detailed overview of the window, see the Profiler window documentation.
This section covers the following topics:
- Profiling your application
- Common Profiler markers
- Getting started with the Profiler window
- Low level native plug-in Profiler API
How to profile and optimize your application
For best-practice information on how to profile your application, and the sort of things you can adjust through profiling, see the following guides and tutorials:
- Performance and Optimization - Unity Learn tutorial on the Profiler and performance and optimization tips.
- Best practices for performance optimization in Unity - Best practice guides on optimizing your application.
- Ultimate guide to profiling Unity games - An e-book that describes how to effectively profile your Unity application.