Highlights Profiler Module
The Highlights ProfilerA window that helps you to optimize your game. It shows how much time is spent in the various areas of your game. For example, it can report the percentage of time spent rendering, animating, or in your game logic. More info
See in Glossary module displays information on whether your application is meeting its target frame rate and if its performance is bound by the CPU or the GPU. It can help you to determine if your application is CPU bound or GPU bound and where to begin investigating potential performance problems.

This module is not enabled by default. To enable the Highlights Profiler module, open the Profiler window, select the Profiler Modules dropdown menu, and toggle the Highlights checkbox.
Chart
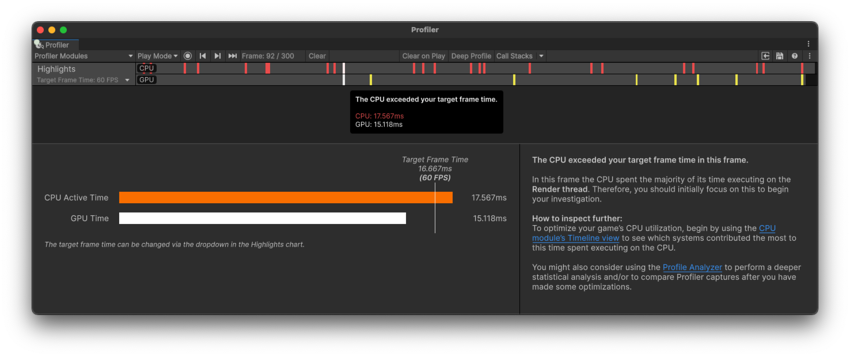
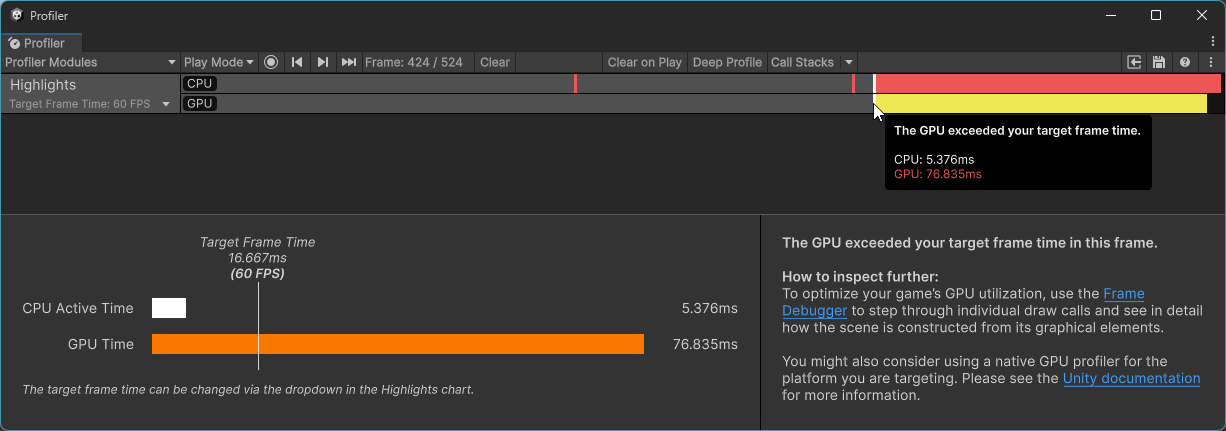
The Highlights chart will flag any frames that have exceeded the application’s target frame rate. It displays this information in two lanes of markers. The top lane displays red markers in any frames where the CPU has exceeded the target frame time. The bottom lane displays yellow markers in any frames where the GPU has exceeded the target frame time. You can hover over any frame in the chart to see a short summary of the frame, including the times of the CPU and the GPU.
The target frame time can be configured in the title area of the chart on the left. You do this by selecting a target ‘frames per secondThe frequency at which consecutive frames are displayed in a running game. More info
See in Glossary’ (FPS) from the dropdown. You can use one of the presets, such as 30, 60 or 72, or select Custom to set your own. This setting should match the target FPSSee first person shooter, frames per second.
See in Glossary of the application being profiled.
You can use this chart view to be easily directed to any problematic frames, as well as to get a sense of how CPU or GPU heavy your application is over the whole capture.
Details
When you select a frame in the Highlights chart, the module’s Details view displays more detailed information about the frame.
The CPU Active Time and GPU Time are displayed as bars relative to the target frame time. In order to achieve your target frame rate, CPU Active Time and the GPU Time must be kept below the target frame time. The reason that both the CPU and the GPU each individually have the full frame time to complete their work is because the Unity engine pipelines, or parllelizes, CPU and GPU work to achieve optimal performance. Clicking on these bars will open the CPU timeline or Frame Debugger respectively to begin your performance investigation.
CPU Active Time
The CPU Active Time is the duration within the frame that the CPU was doing work for. This is computed by taking the longest thread duration between the main thread and the render thread after subtracting the time that thread spent waiting.
On the Main Thread, this means any VSync related markers which don’t represent actual work on the thread, such as
WaitForTargetFPSorGfx.WaitForPresentOnGfxThread(in some scenarios), will be subtracted to calculate the thread’s ‘active time’. On the Render Thread, this means that any time spent waiting for commands as indicated by the markerGfx.WaitForGfxCommandsFromMainThread, which doesn’t represent actual work on the thread, will be subtracted to calculate the thread’s ‘active time’.It is possible for the CPU Active Time to be longer than the ‘CPU Time’ value shown in the CPU Usage module’s Timeline view when the Render Thread took longer than the Main Thread. This is because the Timeline view displays the beginning and end of the frame on the main thread.
GPU Time
GPU Time is the duration between when the GPU was sent its first command for the frame and when the GPU completed its work for that frame.
You can find guidance on the next steps to take and where to begin your performance investigation in the section on the right. For example, in the CPU Bound capture shown below the module is instructing to investigate the Render Thread in the CPU module’s timeline. This means it was the Render Thread that took the longest on the CPU, shown by the CPU Active Time, and it is therefore the Render Thread that is the bottleneck on the CPU which should be investigated first.
