Windows Store Apps: Debugging on .NET Scripting Backend
When you have a crash, or a weird behavior, always check the player log which is located here - <user>\AppData\Local\Packages<productname>\TempState\UnityPlayer.log. When submitting a bug, please include the player log as well, it can give invaluable information.
Currently it’s only possible to debug C# scripts.
Note: Windows Store Apps are running with Microsoft .NET, that’s why it’s not possible to debug scripts with MonoDevelop, instead you have to use Visual Studio 2013.
Here are simple steps how to do it:
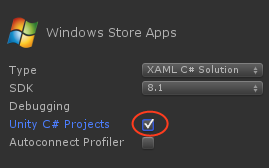
- When building to Windows Store Apps, check Unity C# projects

- This will create Assembly-CSharp-* projects compatible with Windows Store Apps
- Note: if previously Unity C# projects was unchecked, build to empty folder or delete .sln and .csproj, because Unity needs to add references to those files, but if they’ll be present - Unity won’t overwrite them
- Open the solution, you should see Assembly-CSharp-* projects included
- Place breakpoints in places of interest, and simply start application with the debugger

Exceptions
When you run the application, you can tell Visual Studio to stop during exception. Go to Debug -> Exceptions:
- Enable Common Language Runtime Exceptions and Managed Debugging Assistants - for managed exceptions
- Enable all exceptions if you’re getting exception in some unknown place
Note: enabling all exceptions will make Visual Studio to stop even at the harmless exceptions like WinRT originate error, WinRT transform error, ignore those and simply continue
Resolving callstack from UnityPlayer.dll
There will be cases when you’ll have a crash in Unity engine itself, you can get useful information if you’re able to resolve the callstack, and provide it in the bug report if needed.
Note: Callstacks from Unity engine can be resolved if .pdb files are available, Unity provides .pdb files for Debug configuration.
Suppose you’ve encountered a crash in Unity engine and hit the breakpoint (Note: Visual Studio can stop at the crash if you enable all exceptions via Debug -> Exceptions menu), go to Debug -> Windows -> Call Stack, Call Stack window should open up, if you don’t see function names from UnityPlayer.dll, that means the symbols weren’t loaded, to fix that, right click on that function and Load Symbols, UnityPlayer.pdb file will be located in [PathToYourProject]>\Players\[Windows80 or Windows81]\[X86 or ARM or X64]\debug.

Microsoft-Windows-TWinUI
This is a log which might provide information why your application didn’t launch without debugger, it can be found in:
Control Panel -> Administrative Tools -> Event Viewer -> Applications And Services Log -> Microsoft -> Windows -> Apps -> Microsoft-Windows-TWinUI/Operational