MonoDevelop
MonoDevelop is the integrated development environment (IDE) supplied with Unity. An IDE combines the familiar operation of a text editor with additional features for debugging and other project management tasks. The text editor will not be covered here since it is fairly intuitive, but the integration of the editor and debugger with Unity are described below.
Setting Up MonoDevelop
MonoDevelop is installed by default with Unity, although there is the option to exclude it from the installation on Windows. You should check that MonoDevelop is set as the external script editor in the Preferences (menu: Unity > Preferences and then select the External Tools panel). With this option enabled, Unity will launch MonoDevelop and use it as the default editor for all script files.
Setting Up the Debugger
To enable MonoDevelop’s source level debugging (see below for details) you should firstly check that the Editor Attaching option is enabled in the Preferences on the External Tools panel. Then, you should synchronize the Unity project with the MonoDevelop project (menu: Assets > Open C# Project). Also, make sure that the Development Build and Script Debugging options are enabled in the Build Settings for your target platform (menu: File > Build Settings).
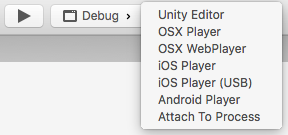
Just before starting a debugging session, select the target you wish to debug from the target list next to the play button (Unity Editor, OSX Player, etc.). You can also select “Attach To Process”, this will show the full list of debuggable Unity processes.
With these steps completed, you are ready to being debugging your Unity scripts by clicking the play button.
Source Level debugging
The currently open source files are shown as tabs in MonoDevelop and can be edited there with the features of a standard text editor. However, there is also a grey breakpoint bar to the left of the editor panel. Clicking in this bar will add a so-called breakpoint marker next to the line of code.
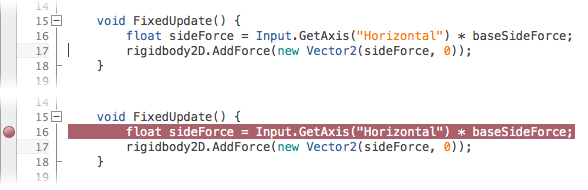
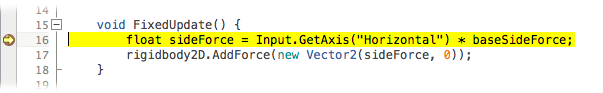
Adding a breakpoint to a line instructs Unity to pause execution of the script just before it reaches that line during Play mode. When the script is “frozen” like this, you can use the debugger to determine exactly what the script is doing.
Information about the state of execution is shown in the tabs at the bottom of the MonoDevelop window when execution is paused at a breakpoint. Perhaps the most important of these is the Locals tab.
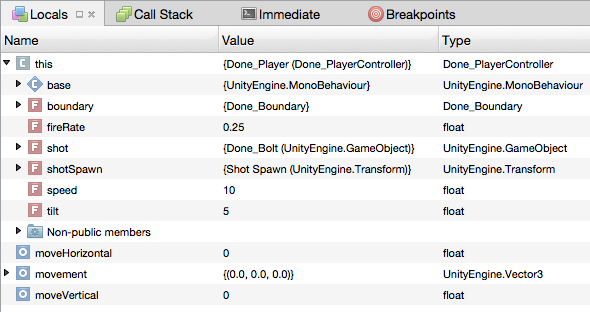
This shows the values of local variables in the function that is currently executing. (A pseudo-local variable called “this” is automatically available in every function without being explicitly defined; it is a reference to the current script instance and so all variables defined in the script can be accessed via “this”.) You can use breakpoints in combination with the Locals tab to get a similar effect to adding print statements to your code - you can interrogate the values of variables at any point you like. However, you can also edit the variable values in the Locals tab. This can be handy when you find a variable incorrectly set and you would like to see if the problem disappears when the value is set how it should be.
A further useful feature of MonoDevelop is single stepping. When execution is paused at a breakpoint, a bar of debugging tools will become available in the top portion of the MonoDevelop window:-

The four buttons are known as Continue, Step Over, Step In and Step Out and can also be accessed as commands on the Run menu. Continue resumes execution until the next breakpoint is encountered. Step Over and Step In both execute one line of code at a time. The difference between the two is that Step Over executes any function calls within the line all at once, while Step In allows the stepwise execution to continue into the function. Since it is common to use Step In accidentally on a function that is known to be correct, Step Out continues execution to the end of the current function and then pauses again in the code that originally called it.
A detailed description of source level debugging techniques is not appropriate here but there are various books and web resources offering wisdom on the subject. Additionally, a little experimentation will help you get a feel for the power of the technique and how you can use it to track down most common types of bugs.
Copyright © 2023 Unity Technologies
优美缔软件(上海)有限公司 版权所有
"Unity"、Unity 徽标及其他 Unity 商标是 Unity Technologies 或其附属机构在美国及其他地区的商标或注册商标。其他名称或品牌是其各自所有者的商标。
公安部备案号:
31010902002961