Rendering Profiler 模块
Rendering Profiler 显示有关 CPU 和 GPU 为渲染场景完成的工作的渲染统计信息和信息。您可以使用这些统计信息来衡量场景不同区域的资源强度,这对优化很有用。
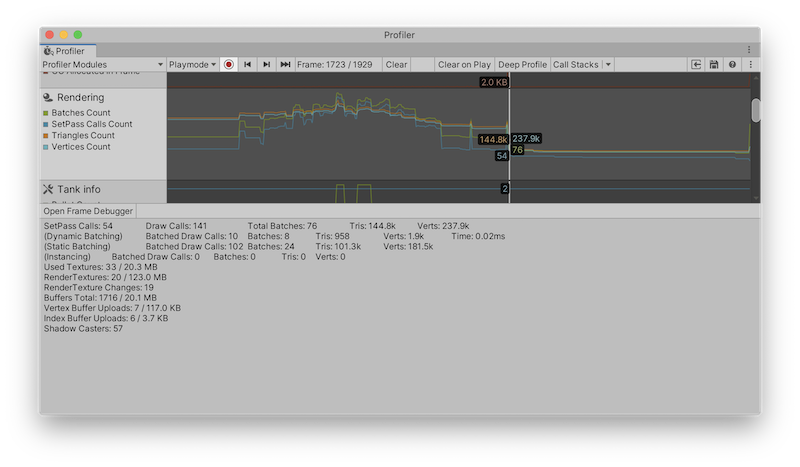
该图表显示您的应用程序渲染的批次 (Batches)、SetPass 调用 (SetPass Calls)、三角形 (Triangles) 和顶点 (Vertices) 的数量。下方的面板将显示更多渲染统计信息,这些统计信息与 GameView Rendering Statistics 窗口中显示的统计信息一致。
 。
。
Rendering Profiler 模块的图表分为四个类别:
| 图表 | 描述 |
|---|---|
| Batches Count | Unity 在一帧内处理的批次数。 |
| SetPass Calls Count | Unity 在一帧中切换用于渲染游戏对象的着色器通道的次数。一个着色器可能包含多个着色器通道,每个通道以不同的方式渲染场景中的游戏对象。 |
| Triangles Count | Unity 在一帧内处理的三角形数。 |
| Vertices Count | Unity 在一帧内处理的顶点数。 |
模块详细信息面板
当您单击 Rendering Profiler 模块时,窗口下半部分的详细信息窗格会显示详细的渲染统计信息。这些统计数据类似于 Rendering Statistics 窗口中显示的内容。
在详细信息窗格的左上角,选择 Open Frame Debugger 以打开帧调试器,它为您提供有关渲染帧的各个绘制调用的信息。
These statistics are also available via the ProfilerRecorder API and in the Profiler Module Editor so you can add them to a custom Profiler module.
| 统计信息 | 描述 | 在发行版播放器中可访问 |
|---|---|---|
| SetPass Calls Count | Unity 在一帧中切换用于渲染游戏对象的着色器通道的次数。一个着色器可能包含多个着色器通道,每个通道以不同的方式渲染场景中的游戏对象。 | 是 |
| Draw Calls Count | Unity 在一帧内发出的绘制调用总数。Unity 在将游戏对象渲染到屏幕时发出绘制调用。这个数字包括非批量绘制调用以及动态和静态批量绘制调用。 | 是 |
| Total Batches Count | Unity 在一帧内处理的批次总数。这个数字包括静态和动态批次。 | 是 |
| Triangles Count | Unity 在一帧内处理的三角形数。 | 是 |
| Vertices Count | Unity 在帧期间处理的顶点数。 | 是 |
| (Dynamic Batching) | 本部分包含有关动态批处理的统计数据。 | 否 |
| Dynamic Batched Draw Calls Count | Unity 合并为动态批次的绘制调用数。 | 否 |
| Dynamic Batches Count | Unity 在帧期间处理的动态批次数。 | 否 |
| Dynamic Batched Triangles Count | 动态批次中包含的游戏对象中的三角形数。 | 否 |
| Dynamic Batched Vertices Count | 动态批次中包含的游戏对象中的顶点数。 | 否 |
| Dynamic Batching Time | Unity 创建动态批处理结构所花费的时间。 | 否 |
| (Static Batching) | 本部分包含有关静态批处理的统计数据。 | 否 |
| Static Batched Draw Calls Count | Unity 合并为静态批次的绘制调用数。 | 否 |
| Static Batches Count | Unity 在一帧内处理的静态批次数。 | 否 |
| Static Batched Triangles Count | 静态批次中包含的游戏对象中的三角形数。 | 否 |
| Static Batched Vertices Count | 静态批次中包含的游戏对象中的顶点数。 | 否 |
| (Instancing) | 本部分包含有关 GPU 实例化的统计数据。 | 否 |
| Instanced Batched Draw Calls Count | Unity 合并为实例化批次的绘制调用数。 | 否 |
| Instanced Batches Count | Unity 在一帧内渲染实例化游戏对象的处理批次数。 | 否 |
| Instanced Batched Triangles Count | 实例化游戏对象中的三角形数。 | 否 |
| Instanced Batched Vertices Count | 实例化游戏对象中的顶点数。 | 否 |
| Used Textures Count Used Textures Bytes |
Unity 在帧期间使用的纹理数以及纹理使用的内存量。 | 否 |
| Render Textures Count Render Textures Bytes |
Unity 在帧期间使用的 RenderTextures 数以及 RenderTextures 使用的内存量。 | 是 |
| Render Textures Changes Count | Unity 在帧期间将一个或多个 RenderTextures 设置为渲染目标的次数。 | 是 |
| Used Buffers Count Used Buffers Bytes |
所使用的 GPU 缓冲区和内存的总数。这包括顶点、索引和计算缓冲区以及渲染所需的所有内部缓冲区。 | 是 |
| Vertex Buffer Upload In Frame Count Vertex Buffer Upload In Frame Bytes |
CPU 在帧中上传到 GPU 的几何体数量。这代表顶点/法线/ texcoord 数据。GPU 上可能已经有一些几何体。此统计信息仅包括 Unity 在帧中传输的几何体。 | 是 |
| Index Buffer Upload In Frame Count Index Buffer Upload In Frame Bytes |
CPU 在帧中上传到 GPU 的几何体数量。这表示三角形索引数据。GPU 上可能已经有一些几何体。此统计信息仅包括 Unity 在帧中传输的几何体。 | 是 |
| Shadow Casters Count | 在一帧中投射阴影的游戏对象的数量。如果一个游戏对象投射多个阴影(因为多个光源照亮它),该对象投射的每个阴影都有一个条目。 | 是 |
播放器中的可用性
Rendering 模块的 Profiler 计数器也可在播放器中使用。使用 ProfilerRecorder API 访问播放器中的 Render Profiler 模块信息。发行版播放器中还提供了高级计数器。
以下示例包含一个简单的脚本,该脚本收集“SetPass Calls Count”、“Draw Calls Count” 和 “Vertices Count”指标并将其显示为 TextArea。
using System.Text;
using Unity.Profiling;
using UnityEngine;

public class RenderStatsScript : MonoBehaviour
{
    string statsText;
    ProfilerRecorder setPassCallsRecorder;
    ProfilerRecorder drawCallsRecorder;
    ProfilerRecorder verticesRecorder;

    void OnEnable()
    {
        setPassCallsRecorder = ProfilerRecorder.StartNew(ProfilerCategory.Render, "SetPass Calls Count");
        drawCallsRecorder = ProfilerRecorder.StartNew(ProfilerCategory.Render, "Draw Calls Count");
        verticesRecorder = ProfilerRecorder.StartNew(ProfilerCategory.Render, "Vertices Count");
    }

    void OnDisable()
    {
        setPassCallsRecorder.Dispose();
        drawCallsRecorder.Dispose();
        verticesRecorder.Dispose();
    }

    void Update()
    {
        var sb = new StringBuilder(500);
        if (setPassCallsRecorder.Valid)
            sb.AppendLine($"SetPass Calls: {setPassCallsRecorder.LastValue}");
        if (drawCallsRecorder.Valid)
            sb.AppendLine($"Draw Calls: {drawCallsRecorder.LastValue}");
        if (verticesRecorder.Valid)
            sb.AppendLine($"Vertices: {verticesRecorder.LastValue}");
        statsText = sb.ToString();
    }

    void OnGUI()
    {
        GUI.TextArea(new Rect(10, 30, 250, 50), statsText);
    }
}
Rendering Profiler 模块信息属于 ProfilerCategory.Render 性能分析器类别。
如果要在自定义模块中突出显示选定的渲染计数器,请使用 Module Editor 配置图表及详细视图。
Copyright © 2023 Unity Technologies
优美缔软件(上海)有限公司 版权所有
"Unity"、Unity 徽标及其他 Unity 商标是 Unity Technologies 或其附属机构在美国及其他地区的商标或注册商标。其他名称或品牌是其各自所有者的商标。
公安部备案号:
31010902002961