- Unity User Manual 2022.1
- 脚本
- 设置脚本编写环境
- Stack trace logging
Stack trace logging
Unity Console messages and log files can include detailed stack trace information. The console also links to the line of code that generated the message. This is useful when you want to identify the line, method, or sequence of function calls that caused the log entry to appear.
Tip: Another way to inspect your code is to attach a debugger to the Editor or your built player.
Stack trace for managed and unmanaged code
Unity can provide stack trace information for both managed and unmanaged code:
Managed code: Managed DLLs or C# scripts running in Unity. These can be scripts that ship with Unity, custom scripts that you write, third-party scripts included with an Asset store plug-in, or any other C# script that runs in the engine.
Unmanaged code: Native Unity engine code, or code from a native plugin running directly on your machine or on a target build platform. Unmanaged code is usually compiled from C or C++ code. You can only access it if you have the original source code of the native binary. Typically, you will use stack trace for unmanaged code only if you need to determine whether an error is caused by your code or the engine code, and which part of the engine code.
Unity offers three stack trace options:
- None: Unity doesn’t output stack trace information.
- ScriptOnly: Unity outputs stack trace information only for managed code. This is the default option.
- Full: Unity outputs stack trace information for both managed and unmanaged code.
Stack trace resource requirements
Resolving a stack trace, especially a full stack trace, is a resource-intensive operation. Some best practices for stack traces include:
- Use stack traces only to debug. Do not deploy an application to users with stack trace enabled.
- Limit the type of messages that display a stack trace. For example, consider using stack trace only for exceptions and warnings.
Setting the stack trace type
Note: The stack trace option is a build setting and affects the built player. It is not a view preference in the Editor.
To specify how much detail to include in the stack trace, you can use the scripting API or the Editor:
To control stack trace logging through the scripting API, use Application.SetStackTraceLogType. You can use the API to change the stack trace setting of a player before it’s built, or while it’s running.
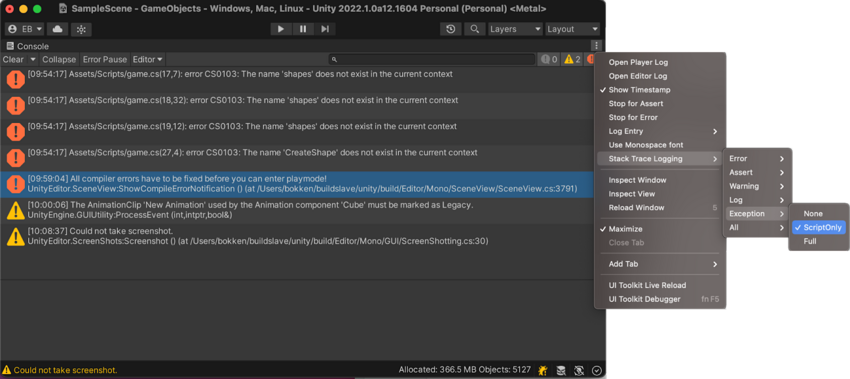
- To use the Console, select the Console menu button, then:
- To select the same stack trace option for all Console message types, select Stack Trace Logging > All.
- To select a stack trace option for just one of the Console message types, select Stack Trace Logging > [MESSAGE TYPE]. Rebuild your player with the new setting.
To use the Player Settings window, select File > Build Settings > Player Settings > Other Settings. Rebuild your player with the new setting.

Open source files from the stack trace output
The full text of a message includes references to specific lines in code files with links. Click any link to open the file in your IDE at the referenced line.
Find the output log file of a built application
Built applications do not output to the Console. To see the stack trace, use the application’s log file.