Debug C# code in Tuanjie
You can use a debugger to inspect your source code while your application is running. Tuanjie supports the following code editors to debug C# code:
- Visual Studio(包含 Visual Studio Tools for Unity 插件)
- Visual Studio for Mac
- Jetbrains Rider
- Visual Studio Code (experimental)
Although these code editors vary slightly in the debugging features they support, they all provide basic functionality such as break points, single stepping, and variable inspection. You can attach these code editors to the Tuanjie Editor or Tuanjie Player to debug your code.
团结引擎中的托管代码调试适用于除 WebGL 之外的所有平台。同时支持Mono 和 IL2CPP 脚本后端。微信小游戏平台的托管代码调试请参考微信小游戏代码断点调试。
Configure the code editor
Visual Studio (Windows)
在 Tuanjie Hub 中安装 Tuanjie Editor 的时候可以选择是否安装 Visual Studio(如果还没有安装)。

这里安装的 Visual Studio 会默认装有如下图的组件

如果已经安装了 Visual Studio 则可以通过 Tools > Get Tools and Features… 来获取对应的组件。
Visual Studio for Mac
Unity Editor 安装程序包括一个选项,允许安装 Visual Studio for Mac。建议通过这种方式设置 Visual Studio for Mac 以便在 Unity 中执行调试。
If Visual Studio for Mac is already installed on your computer, open it and go to Visual Studio > Extensions > Install from file… to locate and install the Visual Studio Tools for Unity plug-in.
JetBrains Rider
您可以使用JetBrains Rider的默认安装在Windows或Mac上调试团结中的代码。 访问 JetBrains website 来进行安装。
Visual Studio Code
为了在 Visual Studio Code 中调式,需要安装一些扩展

安装完成之后会有 Command Palette 下图两个命令

之后在 Tuanjie Editor 中配置一下 Script Editor 为 Visual Studio Code,再执行 Attach Uniyt Debugger 命令即可成功连接。Tuanjie 对 Visual Studio Code 是实验性的,因为 Tuanjie 不只是支持该扩展。
Specify the External Script Editor in Tuanjie
Once you’ve installed a code editor, open Tuanjie, go to Preferences > External Tools and set the External Script Editor to your code editor.
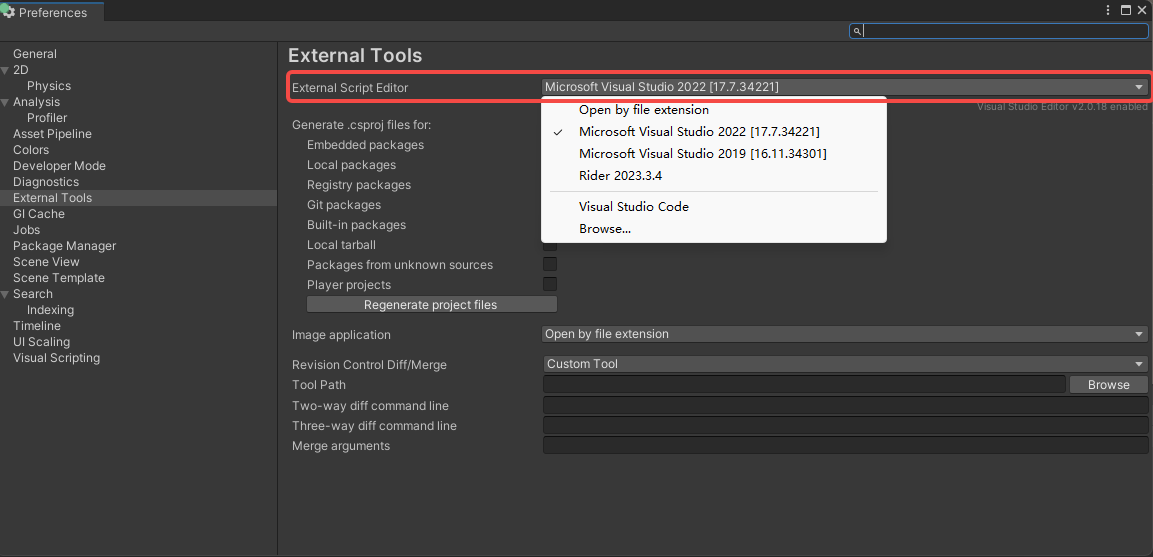
Breakpoints
Breakpoints allow you to specify points in your code where you want to pause its execution. In your external code editor, you can set a breakpoint on a line of code where you want the debugger to stop. While the code editor is at a breakpoint, you can view the contents of variables step by step.
If you have attached your code editor to the Tuanjie Editor (see Attach your code editor to the Tuanjie Editor), the Tuanjie Editor becomes unresponsive until you choose the continue option in your code editor, or stop debugging mode.
To see how you can set breakpoints in Visual Studio see Set breakpoints in Visual Studio.
Debug in the Tuanjie Editor
You can debug C# code as it runs in the Tuanjie Editor while the Tuanjie Editor is in Play Mode.
To debug in the Editor, you need to set the Editor’s Code Optimization mode to Debug Mode, then you can attach a code editor with a debugging feature.
To change the Code Optimization mode, select the Debug Button in the bottom right of the Tuanjie Editor Status Bar.

Tuanjie’s Code Optimization setting has two modes:
- Debug Mode, which you can use to attach external debugger software, but gives slower C# performance when you run your Project in Play Mode in the Editor.
- Release Mode, which gives faster C# performance when you run your Project in Play Mode in the Editor, but you cannot attach any external debuggers.
When you click the Debug button in the status bar, a small pop-up window opens which contains a button you can use to switch modes. The window also displays information about the current mode, and describes what happens if you switch modes.
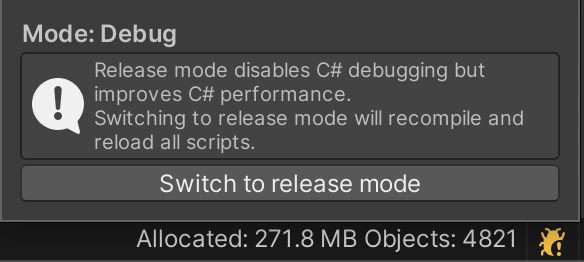
To change which mode the Tuanjie Editor starts up in, go to Edit (macOS: Unity) > Preferences > General > Code Optimization On Startup.
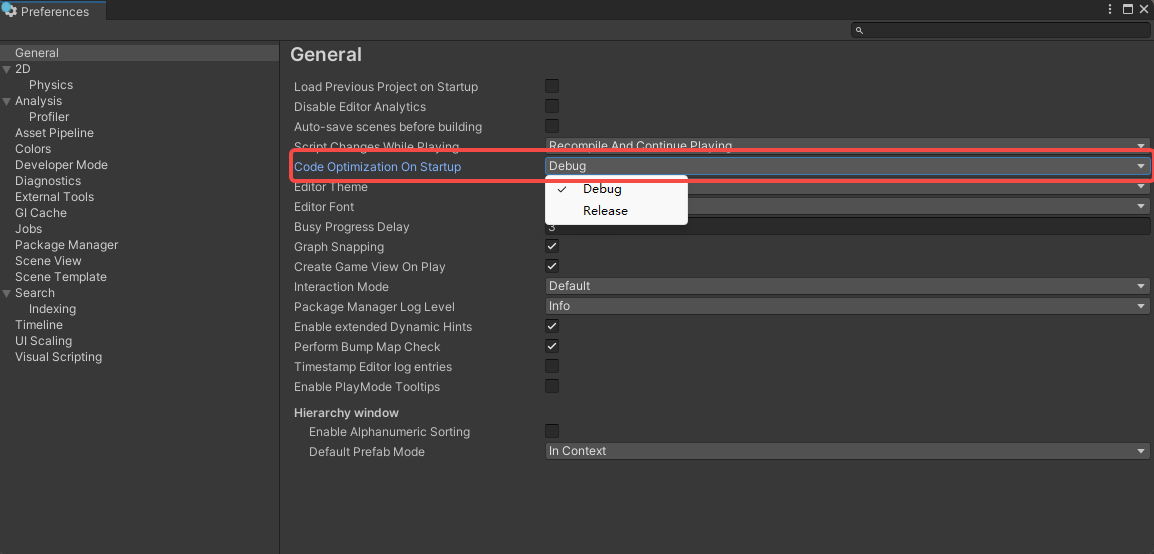
To control these settings using a script, use the following API:
您还可以覆盖编辑器启动时的模式,或关闭调试器侦听套接字。为此,当您启动编辑器时请使用以下命令行参数:
-
-releaseCodeOptimization. Starts the Editor in Release code optimization mode. -
-debugCodeOptimization. Starts the Editor in Debug code optimization mode. -
-disableManagedDebugger. Starts the Editor with the debugger listen socket disabled.
Attach your code editor to the Tuanjie Editor
首先按照上面提到的方式对代码编辑器进行配置,之后就是在 Tuanjie Editor 中选择要使用哪个代码编辑器,之后双击脚本文件即可以用对应的代码编辑器来打开。之后不同的代码编辑器和 Tuanjie Editor 进行连接的方式略有不同,Attach Visual Studio to the Tuanjie Editor 和 Attach Rider to the Tuanjie Editor会具体展示如何用 Visual Studio 和 Rider 来连接 Tuanjie Editor。
当你连接完成之后,只需要让 Tuanjie Editor 进入 Play Mode 就可以对代码进行调式。
Debug in the Tuanjie Player
To compile a Tuanjie Player for you to debug:
- Go to File > Build Settings.
- Enable the Development Build and Script Debugging options before you build the Player. You could also enable the Wait For Managed Debugger option to make the Player wait for a debugger to be attached before the Player executes any script code.
- Select Build And Run.
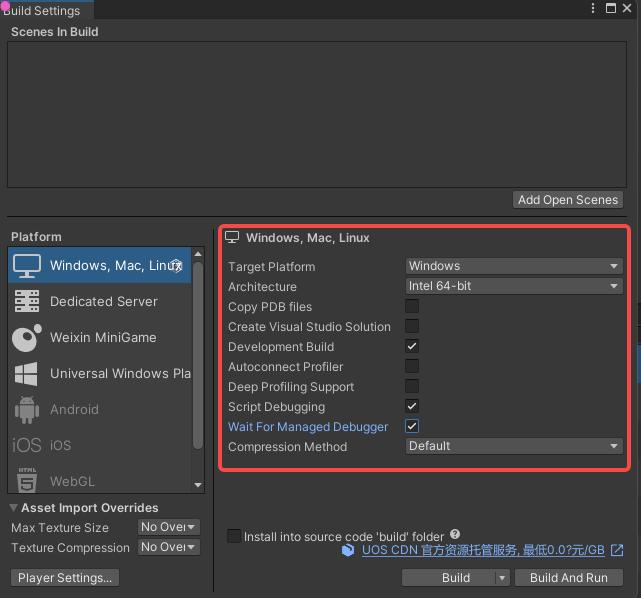
Attach your code editor to the Tuanjie Player
To attach your code editor to the Tuanjie Player, in your code editor, select the IP address (or machine name) and port of your Player. For an example of where to find this in Visual Studio, see Attach Visual Studio to the Tuanjie Editor.
Note: Your code editor will show all instances of Tuanjie that are available to debug. Make sure you attach the code editor to the correct instance of the Tuanjie Player, and not to the Tuanjie Editor if both are running.
When you have attached the debugger, you can begin debugging normally. For an example of how to attach a Tuanjie Player that runs on a mobile device to Visual Studio, see Debug Android and iOS devices with Visual Studio.
Set breakpoints in Visual Studio
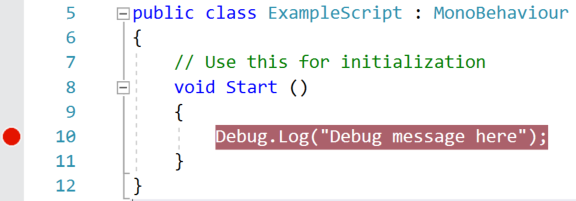
To set a breakpoint in Visual Studio, click on the column to the left of your code, on the line you want to stop the debugger. A red circle appears next to the line number and the line is highlighted.
Attach Visual Studio to the Tuanjie Editor
打开 Tuanjie 的项目,将代码编辑器更改为 Visual Studio,后双击对应的脚本文件,打开 Visual Studio。之后点击下图所示的选项

之后就会弹出下图所示的选择列表,可以看到有开启的 Tuanjie Editor,这里可以有多个 Editor,因此在选择的时候需要确定具体是哪个,可以通过项目名称来进行确定。选择对应的 Editor 点击确定即可连接。

如果没有找到需要的 Tuanjie 实例,也可以通过输入 IP 和 端口号来进行连接,点击下图选项

在弹窗中输入对应 Tuanjie 实例的 IP 和 端口号,点击确定即可进行连接

更多参考资料:Code editor external documentation
Attach Rider to the Tuanjie Editor
打开 Tuanjie 的项目,将代码编辑器更改为 Rider,后双击对应的脚本文件,打开 Rider。之后点击下图所示的选项,就可以连接上去了

如果没有找到所需的 Tuanjie 实例,也可以通过输入 IP 和 端口号来进行连接,点击下图选项

就会出现下图的弹窗,然后点击 Add Player Address Manually…,填写对应的 IP 和 端口号即可

该界面会显示 Rider 找到的 Tuanjie 实例和手动添加的 IP,之后可以选择自己需要连接的 Tuanjie 实例,点击 OK 进行连接即可

更多参考资料:Code editor external documentation
Debug Android and iOS devices with Visual Studio
Android
To debug a Tuanjie Player running on an Android device, connect to the device using USB or TCP. For example, to connect to an Android device in Visual Studio, select Debug > Attach Unity Debugger option. A list of devices running a Player instance appears.

In this example, the android device is connected using USB and Wi-Fi on the same network as the workstation running the Tuanjie Editor and Visual Studio.
Android on ChromeOS
Tuanjie can’t automatically discover ChromeOS devices. To initiate a connection, connect to the device through Android Debug Bridge (adb). For more information about how to use adb, refer to the Android Studio User Guide.
iOS
To debug a Unity Player running on an iOS device, connect to the device using TCP. For example, to connect to an iOS device in Visual Studio for Mac, select Debug > Attach Unity Debugger. A list of devices running a Player instance appears.

Ensure that the device only has one active network interface (Wi-Fi recommended, turn off cellular data) and that there is no firewall between the IDE and the device blocking the TCP port (port number 56000 in the above screenshot).
Important: iOS doesn’t support debugging over USB.
Troubleshoot the debugger
Most problems with the debugger occur because the code editor is unable to locate the Tuanjie Editor or the Tuanjie Player. This means that the Tuanjie Editor or Player can’t attach the debugger properly. Because the debugger uses a TCP connection to the Editor or Player, connection issues are often caused by the network. Below are a few steps you can take to troubleshoot basic connection issues.
确保将调试器连接到正确的 Tuanjie 实例
You can attach your code editor to any instance of the Tuanjie Editor or Tuanjie Player on the local network that has debugging enabled. When you attach the debugger, ensure that you attach it to the correct Tuanjie instance. If you know the IP address or machine name of the device on which you are running the Tuanjie Player, this helps to locate the correct instance.
验证与 Tuanjie 实例的网络连接
The code editor uses the same mechanism to locate a Tuanjie instance to debug as the Tuanjie Profiler. If the code editor can’t find the Tuanjie instance you expect, try to attach the Tuanjie Profiler to that instance. If the Tuanjie Profiler cannot find the Tuanjie instance either, there might be a firewall on the machine you are running the code editor or Tuanjie instance on. If a firewall is in place, see Check the firewall settings.
Ensure the device only has one active network interface
Many devices have multiple network interfaces. For example, a mobile phone might have both an active cellular connection and an active Wi-Fi connection. To properly connect the debugger to the Tuanjie instance using TCP, the IDE needs to make a network connection to the correct interface on the device. If you plan to debug over Wi-Fi, for example, make sure you put the device in airplane mode to disable all other interfaces, then enable Wi-Fi.
You can determine which IP address the Tuanjie Player tells the IDE to use by looking in the Player Log. Look for a part of the log like this:
Multi-casting "[IP] 10.0.1.152 [Port] 55000 [Flags] 3 [Guid] 2575380029 [EditorId] 4264788666 [Version] 1048832 [Id] iPhonePlayer(Example-iPhone):56000 [Debug] 1 [PackageName] iPhonePlayer" to [225.0.0.222:54997]...
此消息表明 IDE 将尝试使用 IP 地址 10.0.1.152 和端口 56000 来连接到设备。运行 IDE 的计算机必须能访问此 IP 地址和端口。
Check the firewall settings
The Tuanjie instance communicates with the code editor using a TCP connection. On most Tuanjie platforms, this TCP connection occurs on an arbitrarily chosen port. Normally, you shouldn’t need to know this port, as the code editor should detect it automatically. If that doesn’t work, use a network analysis tool to determine which ports might be blocked either on the machine where you are running the code editor, or the machine or device where you are running the Tuanjie instance. When you find the ports, make sure that your firewall allows access to the port on both the machine running the code editor, and the machine running the Tuanjie instance.
验证托管调试信息是否可用
If the debugger attaches to the Tuanjie instance but breakpoints don’t load, the debugger might not be able to locate the managed debugging information for the code. Managed code debugging information is stored in files named .pdb, next to the managed assembly (.dll file) on the disk.
When you enable the correct preferences and build options (see Configure the code editor), Tuanjie generates this debugging information automatically. However, Tuanjie cannot generate debugging information for managed plugins in your project. You can only debug code from managed plugins if the associated .pdb files are next to the managed plugins in the Tuanjie project on disk.
防止设备锁定
Disable any screen locks on the device you are using to debug your application. Screen locks cause the debugger to disconnect, and prevent it from re-connecting. Don’t lock the screen during managed code debugging. If the screen locks, restart the application on the device so the debugger can connect again.
Memory and thread leaks due to the debugger
The implementation of the managed debugger will leak some OS-level thread handles and some memory related to threads in order to handle some race conditions related to thread startup and shutdown. In practice these leaks are small, and should not impact the resource usage of an application. However, when many threads are created and destroyed, the leaks can be noticeable. This behavior can also make it difficult to track down actual memory leaks, so we recommend disabling scripting debugging when troubleshooting memory leaks.
Code editor external documentation
- Visual Studio - Using Visual Studio Tools for Unity (Windows)
- Visual Studio for Mac - Using Visual Studio Tools for Unity (macOS)
- Jetbrains Rider - Debug Unity Applications