- Unity User Manual 2021.1 (beta)
- Working in Unity
- Analysis
- Profiler overview
- The Profiler window
- GPU Usage Profiler module
GPU Usage Profiler module
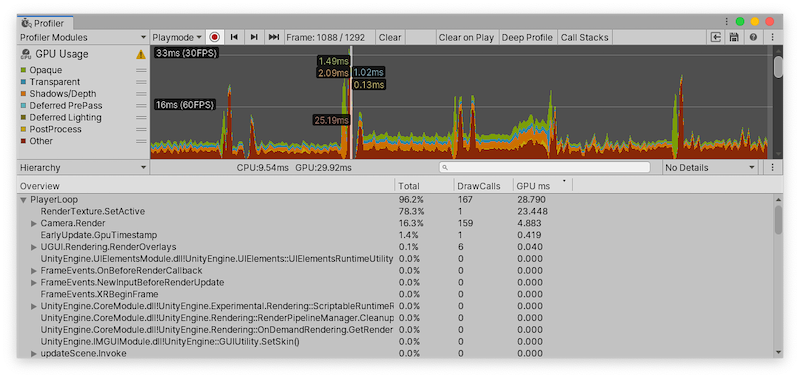
The GPU Usage Profiler module displays where your application spends time in the GPU. You can only use the GPU Profiler in Playmode, or for builds of your application. You cannot use it to profile the Editor.

Note: If you have Graphics Jobs enabled in the Player Settings, GPU profiling is not supported. For more information, see the documentation on Standalone Player Settings. Additionally, on macOS, you can only profile the GPU on Mavericks 10.9 or later.
GPU profiling support
The following table lists the platforms that the GPU Usage Profiler module supports:
| Platform | Graphics API | Status |
|---|---|---|
| Windows | DirectX 11, DirectX 12, OpenGL | Soportado |
| Vulkan | Not supported | |
| macOS | OpenGL | Supported. Note: Apple has deprecated support of OpenGL. |
| Metal | Not supported. Use XCode’s GPU Frame Debugger UI instead. | |
| Linux | OpenGL core | Soportado |
| Vulkan | Not supported | |
| PlayStation 4 | libgnm | Supported. |
| Xbox One | DirectX 11, DirectX 12 | Supported. |
| Switch | Switch API | Soportado |
| WebGL | All WebGL | Not supported |
| Android | OpenGL | Supported on devices running NVIDIA or Intel GPUs. |
| Vulkan | Not supported | |
| iOS, tvOS | Metal | Not supported. Use XCode’s GPU Frame Debugger UI instead. |
| Tizen | OpenGL | Not supported. |
On Windows, Unity supports Playmode profiling in the Editor with Direct3D 9 and Direct3D 11 APIs only. This is convenient for quick profiling, because it means you don’t need to build the Player; however, the overhead of running the Unity Editor affects the Profiler, which might make the profiling results less accurate.
Chart categories
The GPU Usage Profiler module’s chart has several different categories that you can use to investigate GPU timings. To change the order of the categories in the chart, you can drag and drop them in the chart’s legend. You can also click a category’s colored legend to toggle its display.
| Chart category | Descripción |
|---|---|
| Opaque | Built-in rendering pipeline’s time to render opaque objects |
| Transparent | Built-in rendering pipeline’s time to render transparent objects |
| Shadows/Depth | Built-in rendering pipeline’s time to render shadow maps |
| Deferred PrePass | Built-in deferred rendering pipeline’s time to render depth buffer pre pass. |
| Deferred Lighting | Built-in deferred rendering pipeline’s time to do lighting. |
| PostProcess | Built-in rendering pipeline’s time to process post processing effects. |
| Other | Rendering time to process other things such as Scriptable Rendering Pipelines |
Module details pane
When you select the GPU Usage module, the details pane below it displays a breakdown of where the application spent time in the selected frame. You can display the timing data as a hierarchical table. To change the table views, use the top-left dropdown in the details pane (set to Hierarchy by default). The views available are:
| View | Función: |
|---|---|
| Hierarchy | Groups the timing data by its internal hierarchical structure. This option displays the elements that your application called in a descending list format, ordered by the time spent by default. You can also order the information by the total amount of GPU time, or the number of calls. To change the column that orders the table, click the table column’s header. |
| Raw Hierarchy | Displays the timing data in a hierarchical structure that is similar to the call stacks where the timing occurred. Unity lists each call stack separately in this mode instead of merging them, as it does in Hierarchy view. |
When you select the GPU Usage Profiler module, the lower pane of the Profiler displays hierarchical time data for the selected frame. Select an item from the Hierarchy to see a breakdown of contributions in the right-hand panel. See documentation on the Profiler window to learn more about the Profiler window’s functionality.
The table views have the following columns:
| Column | Función: |
|---|---|
| Total | The total amount of time Unity spent on a particular function, as a percentage. |
| DrawCalls | The number of calls made to this function in this frame. |
| GPU ms | The total amount of time Unity spent on a particular function, in milliseconds. |