Asset Loading Profiler module
The Asset Loading Profiler module displays information about how your application loads assets, including a breakdown of read operations by area. The details pane provides an insight into each of the asset loading markers captured during the profile. You can use this information to determine how efficiently your application loads assets, and to identify any specific issues.
This module is not enabled by default. To enable the Asset Loading Profiler module, open the Profiler window, select the Profiler Modules dropdown menu, and toggle the Asset Loading checkbox.
チャートのカテゴリ
The Asset Loading Profiler module’s chart is divided into seven categories. To change the order of the categories in the chart, you can drag and drop them in the chart’s legend. You can also click a category’s colored legend to toggle its display. For more information on how to use the Profiler window, see Getting started with the Profiler window.
| チャート | 説明 |
|---|---|
| Other Reads | The number of bytes requested from the AsyncReadManager for an unspecified subsystem. |
| Texture Reads | The number of bytes requested from the AsyncReadManager for a texture load. |
| Virtual Texture Reads | The number of bytes requested from the AsyncReadManager for Virtual Texturing. |
| Mesh Reads | The number of bytes requested from the AsyncReadManager for a mesh load. |
| Audio Reads | The number of bytes requested from the AsyncReadManager for an audio load. |
| Scripting Reads | The number of bytes requested from the AsyncReadManager via the scripting API. |
| Entities Reads | The number of bytes requested from the AsyncReadManager by scripts in the Entities package. |
モジュールの詳細ペイン
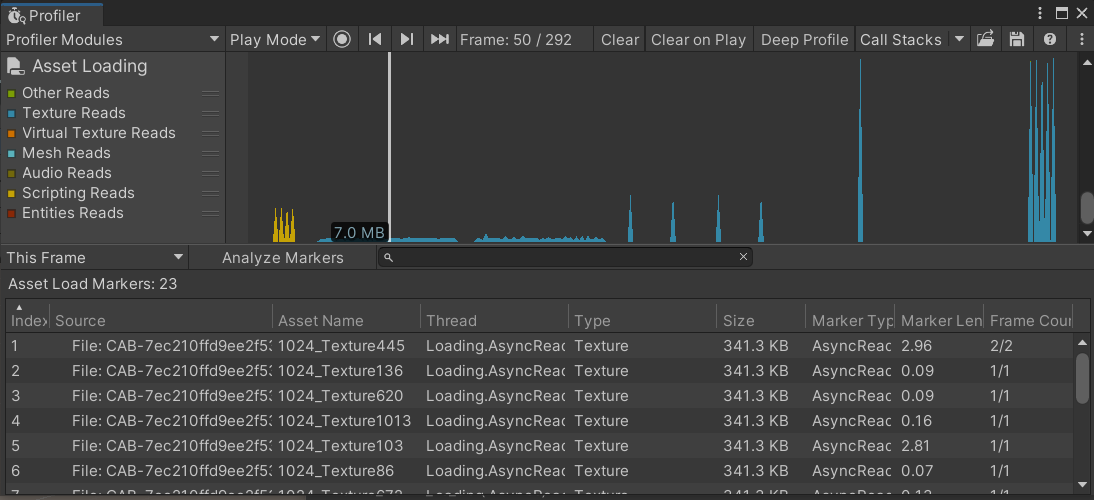
When you select a frame in the Asset Loading Profiler module, the module details pane displays detailed information about how and when assets were loaded during the capture. This module can display information for either a single selected frame, or for all frames in the capture. Use the dropdown menu at the top-left of the details pane to choose between a single frame or all frames. This module doesn’t populate the details pane automatically. Instead, you need to select the Analyze Markers button at the top of the details pane to populate the view with data.
The Asset Markers view displays selected markers related to asset loading during the capture. Some rows have child markers that create a hierarchy, which is initially contained within a single expandable row. Select the dropdown arrow next to the marker’s name to expand the row and display all child markers.
The below table explains all of the possible columns that the Asset Markers view can display. Not all of these columns are enabled by default. To enable or disable a column, right-click anywhere in the row that contains the column names to open the column toggles sub-menu. Select any of the column names in this menu to either enable or disable that column. You can enter text into the search bar next to the Analyze Markers button to filter the results based on the Source column.
| Heading | 説明 | Enabled by default |
|---|---|---|
| Index | An ID number representing the order of execution of the asset loading markers. | あり |
| Source | The origin of the asset Unity is loading. This can be either a file path, an AssetBundle name, or a Scene. Hover your cursor over any entry in this column to show the full source file path for that entry. | あり |
| Asset Name | The name of the asset Unity is loading (if applicable and available in the Profiler’s metadata for the marker). | あり |
| Thread | The thread that this marker occurred on. | あり |
| Type | The type of the Asset. | あり |
| Size | The size of the load recorded by this marker. Note:This size may not include child markers, depending on the marker type. |
あり |
| Marker Type | The type of marker recorded. | あり |
| Marker Length (ms) | The index of the currently selected frame, followed by the total number of frames the marker spans. | あり |
| Frame Count | The index of the currently selected frame, followed by the total number of frames the marker spans. | あり |
| Timestamp (ms) | The time this marker started, relative to the start of the profiler capture. | なし |
| First Frame Index | The frame this marker started on. | なし |
| Last Frame Index | The frame this marker ended on. | なし |
You can right-click on any of the asset loading markers to open a sub-menu with additional options to visualize that data differently. The available options are as follows:
| プロパティ | 機能 |
|---|---|
| Show marker in timeline view | Opens this marker in the CPU Usage Profiler module. |
| Go to the first frame of this marker | Selects the frame in which the marker first appears in the chart. This option is disabled if the marker only appears on one frame. |
| Go to the last frame of this marker | Selects the frame in which this marker last appears in the chart. This option is disabled if the marker only appears on one frame. |
| Filter the view to this source | Populates the search bar with the contents of the Source column to filter the results. |
| Filter the view to this asset name | Populates the search bar with the contents of the Asset Name column to filter the results. This option is disabled if the Asset Name column is empty. |
Copyright © 2023 Unity Technologies
优美缔软件(上海)有限公司 版权所有
"Unity"、Unity 徽标及其他 Unity 商标是 Unity Technologies 或其附属机构在美国及其他地区的商标或注册商标。其他名称或品牌是其各自所有者的商标。
公安部备案号:
31010902002961