- Unity User Manual 2023.2 (beta)
- Create with Unity
- 分析
- プロファイラー概要
- Profiler ウィンドウ
- Virtual Texturing プロファイラーモジュール
Virtual Texturing プロファイラーモジュール
The Virtual Texturing Profiler module displays statistics about Streaming Virtual Texturing in your application. Virtual Texturing reduces the amount of GPU memory that your application uses, and the loading times of textures in your application if there are a lot of high resolution textures in a scene.
ノート: Virtual Texturing プロファイラーモジュールを使用するには、プロジェクトの Player Settings で Virtual Texturing (Edit > Project Settings > Player > Other Settings) を有効にする必要があります。

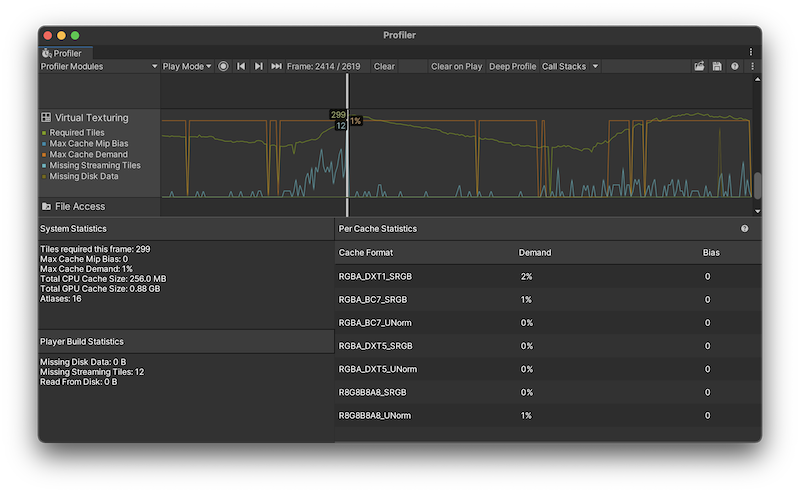
この表には、アプリケーションの実行中に画面上に表示されるテクスチャタイルの情報と、テクスチャが使用するメモリの量が表示されます。Virtual Texturing モジュールを選択すると、Profiler ウィンドウの下ペインに、仮想テクスチャが使用するキャッシュサイズなどの統計情報が表示されます。
Virtual Texturing プロファイラーモジュールの表は、以下のカテゴリーに分かれています。
| チャート | 説明 |
|---|---|
| Required Tiles | The number of texture tiles that were visible on screen. These are the tiles that the shaders tried to sample to render the selected frame. |
| Max Cache Mip Bias | The automatic mipmap bias applied to all textures with the same texture format. If this value isn’t zero, then the cache isn’t large enough to hold all the tiles of that format that are visible. The higher the mip bias, the lower the texture quality. |
| Max Cache Demand | The highest cache demand of all GPU caches in the selected frame. |
| Missing Streaming Tiles | The number of tiles that were visible on the screen but weren’t in video memory. Your application streams these tiles from the disk or copies them from main memory as soon as possible. |
| Missing Disk Data | The remaining data (in bytes) that your application needed to read from the disk to satisfy the selected frame. |
モジュールの詳細ペイン
When you click on the Virtual Texturing Profiler module, the details pane in the lower half of the window displays further detailed statistics. These statistics are also available via the ProfilerRecorder API and in the Profiler Module Editor so you can add them to a custom Profiler module.
詳細ペインに表示される統計情報は以下の通りです。
| 統計 | 説明 |
|---|---|
| System Statistics | This section of the details pane displays information about your application’s texture tiles and the resources they used during the Profiler capture. These statistics are available for both player builds, and profiling Play mode in the Unity Editor. |
| Tiles required this frame | The number of texture tiles that were visible on screen. These are the tiles that the shaders tried to sample to render the selected frame. If all these tiles are in the GPU cache then Unity renders the frame with the highest possible texture quality for the cache size. Unless the Scene was frozen, then some of the tiles weren’t in the GPU memory yet. In this case, the virtual texturing sample uses a lower quality sample from a higher mipmap that’s in memory, until the higher quality sample arrives in memory. The cache mipmap bias affects the number of required tiles. If the mipmap bias isn’t zero for all caches then the number of required tiles is lower than the number required for the optimal texture quality. |
| Max Cache Mip Bias | The mip bias of the GPU cache with the highest mip bias. If this isn’t zero then at least one of the caches isn’t large enough to hold all the texture tiles to render the selected frame at the optimal texture quality. |
| Max Cache Demand | The highest cache demand of all GPU caches the selected frame represented as a percentage of the GPU. The GPU cache that has the highest demand might need to be larger to avoid mipmap biasing for this cache. If the Max Cache Demand statistic is a low percentage then the caches might be too large for the render resolution and content. The main downside of this is that your application is using more GPU memory than it needs but this isn’t a problem if your application isn’t memory constrained. |
| Total CPU Cache Size | The amount of memory that Unity allocated to stored texture tiles after it loaded them from disk. |
| Total GPU Cache Size | The size of all GPU caches that the Virtual Texturing module allocated in the selected frame. Unity creates a GPU cache when a material that uses a texture of that texture format is rendered. |
| Atlases | 仮想テクスチャスペースまたはアトラスの数 (最大64)。Unity は、仮想テクスチャリングでストリームされたテクスチャを、大きな仮想テクスチャスペースにマップします。これは自動的かつ透過的に行われます。 |
| Player Build Statistics | This section of the details pane displays information about your application’s texture tiles that are only available when you profile a build of your application. |
| Missing Disk Data | The remaining data (in bytes) that the application needed to read from disk to satisfy the selected frame. There might be more disk read requests queued up from requests in previous frames that aren’t visible anymore. As such, this is the minimum amount of data that the application reads from disk if no new tiles become visible. The actual amount of data the application reads might be larger. |
| Missing Streaming Tiles | The number of tiles that were visible on the screen but weren’t in memory yet. These tiles were streamed from disk as soon as possible. This number might be higher if, for example, the camera moves. This statistic falls to zero if the scene and camera froze and no new tiles were visible. |
| Read From Disk | The number of bytes of disk read operations that Unity completed in the selected frame. |
| Per Cache Statistics | Displays statistics about the cache. Only available when you profile a build of your application. |
| Cache Format | The graphics formats that the textures in your application used. |
| Demand | The amount of cache demand each graphics format used. Note: This statistic is not available in custom profilers |
| Bias | The amount of mipmap bias cache each graphics format used. Note: This statistic is not available in custom profilers |