Virtual Texturing プロファイラーモジュール
Virtual Texturing プロファイラーモジュールは、アプリケーション内の ストリーミング仮想テクスチャリング に関する統計を表示します。仮想テクスチャリングは、アプリケーションが使用する GPU メモリの量を減らし、シーンに高解像度のテクスチャが多数ある場合には、アプリケーションのテクスチャのロード時間を短縮します。
ノート: Virtual Texturing プロファイラーモジュールを使用するには、プロジェクトの Player Settings で Virtual Texturing (Edit > Project Settings > Player > Other Settings) を有効にする必要があります。
この表には、アプリケーションの実行中に画面上に表示されるテクスチャタイルの情報と、テクスチャが使用するメモリの量が表示されます。Virtual Texturing モジュールを選択すると、Profiler ウィンドウの下ペインに、仮想テクスチャが使用するキャッシュサイズなどの統計情報が表示されます。
Virtual Texturing プロファイラーモジュールの表は、以下のカテゴリーに分かれています。
| チャート | 説明 |
|---|---|
| Required Tiles | 画面上に表示されたテクスチャタイルの数。これらのタイルは、シェーダーが現在のフレームをレンダリングするためにサンプリングしようとしたタイルです。 |
| Max Cache Mip Bias | 同じテクスチャフォーマットのすべてのテクスチャに適用される自動ミップマップバイアス。この値がゼロでない場合、キャッシュは、表示されているその形式のすべてのタイルを保持するのに十分な大きさではありません。ミップバイアスが大きいほど、テクスチャの品質は低くなります。 |
| Max Cache Demand | 選択されたフレームのすべての GPU キャッシュの最大のキャッシュ要求量。 |
| Missing Streaming Tiles | 画面上に表示されていたが、ビデオメモリには含まれなかったタイルの数。アプリケーションは、これらのタイルをディスクからストリームするか、メインメモリから可能な限り早くコピーします。 |
| Missing Disk Data | 選択されたフレームを満たすために、アプリケーションがディスクから読み取る必要のある残りのデータ (単位はバイト)。 |
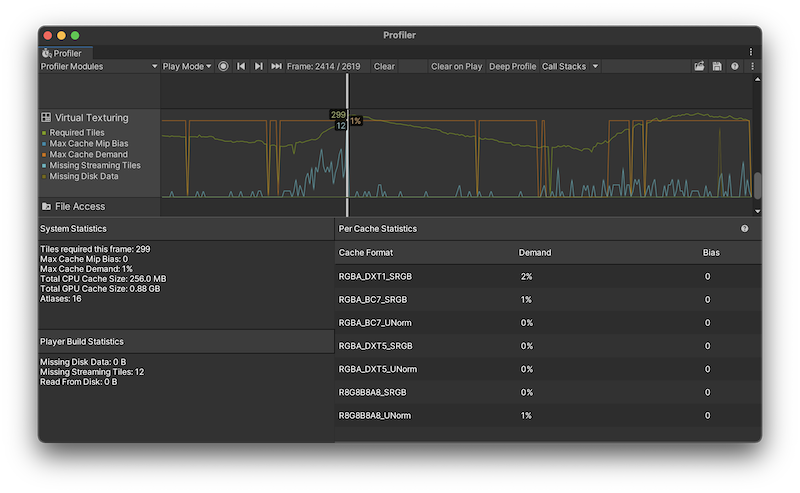
モジュールの詳細ペイン
Virtual Texturing プロファイラーモジュールをクリックすると、ウィンドウの下半分にある詳細ペインに、さらに詳細な統計情報が表示されます。これらの統計情報は、ProfilerRecorder API や Profiler Module Editor でも入手可能で、カスタム製のプロファイラーモジュール に追加することができます。
詳細ペインに表示される統計情報は以下の通りです。
| 統計 | 説明 |
|---|---|
| System Statistics | 詳細ペインのこのセクションには、アプリケーションのテクスチャタイルと、それらがプロファイラーキャプチャ中に使用したリソースに関する情報が表示されます。これらの統計情報は、プレイヤービルドと、Unity エディターの再生モードのプロファイリングの両方で利用できます。 |
| Tiles required this frame | 画面上に表示されたテクスチャタイルの数。これらのタイルは、選択されたフレームをレンダリングするために、シェーダーがサンプリングしようとしたタイルです。これらのタイルがすべて GPU キャッシュにある場合、Unity は選択されたキャッシュサイズで可能な限り高いテクスチャ品質でフレームをレンダリングします。 シーンがフリーズしない限り、これらのタイルの一部はまだ GPU メモリにありません。この場合、仮想テクスチャサンプルは、高品質のサンプルがメモリに到着するまで、メモリにある高品質のミップマップから低品質のサンプルを使用します。 キャッシュミップマップバイアスは、必要なタイルの数に影響します。すべてのキャッシュでミップマップバイアスがゼロでない場合、必要なタイルの数は、最適なテクスチャ品質に必要な数よりも少なくなります。 |
| Max Cache Mip Bias | ミップバイアスが最も高い GPU キャッシュのミップバイアス。これがゼロでない場合、キャッシュの少なくとも 1 つは、すべてのテクスチャタイルを保持し、選択されたフレームを最適なテクスチャ品質でレンダリングするのに十分な大きさではありません。 |
| Max Cache Demand | 選択されたフレームが GPU のパーセンテージとして表されるすべての GPU キャッシュの中で最も高いキャッシュ要求。 Max Cache Demand の統計値が低いパーセンテージの場合、レンダリング解像度とコンテンツに対してキャッシュが大きすぎる可能性があります。この場合の主な欠点は、アプリケーションが必要以上の GPU メモリを使用することですが、アプリケーションがメモリに制約を受けていない場合は問題ありません。 |
| Total CPU Cache Size | ディスクからテクスチャタイルをロードした後に、保存されたテクスチャタイルに割り当てたメモリの量。 |
| Total GPU Cache Size | Virtual Texturing モジュールが選択されたフレームで割り当てたすべての GPU キャッシュのサイズ。Unity は、そのテクスチャ形式のテクスチャを使用するマテリアルがレンダリングされたときに、GPU キャッシュを作成します。 |
| Atlases | 仮想テクスチャスペースまたはアトラスの数 (最大64)。Unity は、仮想テクスチャリングでストリームされたテクスチャを、大きな仮想テクスチャスペースにマップします。これは自動的かつ透過的に行われます。 |
| Player Build Statistics | 詳細ペインのこのセクションには、アプリケーションのビルドをプロファイルするときにのみ利用できる、アプリケーションのテクスチャタイルに関する情報が表示されます。 |
| Missing Disk Data | 選択されたフレームを満たすために、アプリケーションがディスクから読み取る必要のあった残りのデータ (単位はバイト)。表示されなくなった前のフレームの要求から、さらに多くのディスク読み取り要求がキューされている可能性があります。そのため、これは、新しいタイルが表示されなくなった場合に、アプリケーションがディスクから読み取るデータの最小量です。 アプリケーションが読み取る実際のデータ量は、これよりも多くなる可能性があります。 |
| Missing Streaming Tiles | 画面上に表示されていたが、まだメモリにないタイルの数。これらのタイルは、可能な限り早くディスクからストリーミングされます。この数値は、例えばカメラが移動する場合などに大きくなる可能性があります。シーンとカメラがフリーズして新しいタイルが表示されなかった場合は、すぐにゼロになります。 |
| Read From Disk | Unity が選択されたフレームで終了したディスク読み取り操作のバイト数。 |
| Per Cache Statistics | キャッシュに関する統計情報を表示します。アプリケーションのビルドをプロファイルするときのみ利用できます。 |
| Cache Format | アプリケーションのテクスチャが使用した グラフィックス形式。 |
| Demand | 各 グラフィックス形式 が使用したキャッシュ要求。 ノート: この統計値は、カスタムプロファイラーでは利用できません。 |
| Bias | 各 グラフィックス形式 が使用したミップバイアスキャッシュ量。 ノート: この統計値は、カスタムプロファイラーでは利用できません。 |
Copyright © 2023 Unity Technologies
优美缔软件(上海)有限公司 版权所有
"Unity"、Unity 徽标及其他 Unity 商标是 Unity Technologies 或其附属机构在美国及其他地区的商标或注册商标。其他名称或品牌是其各自所有者的商标。
公安部备案号:
31010902002961