IL2CPP로 관리되는 스택 추적
When an exception happens in managed code, the stack trace for the exception can help you understand the cause of the exception. However, the managed stack trace might not appear as expected in some cases. The stack trace varies depending on the build configuration.
C++ Compiler Configuration options
Debug
When you set the C++ Compiler Configuration property to Debug, IL2CPP reports a reliable managed stack trace, and includes each managed method in the call stack. The stack trace doesn’t include line numbers from the original C# source code.
Release and master
When you set the C++ Compiler Configuration property to either the Release or Master setting, IL2CPP might produce a call stack that’s missing one or more managed methods. This happens when the C++ compiler inlines the missing methods. Method inlining usually improves runtime performance, but it can make call stacks more difficult to understand.
IL2CPP always provides at least one managed method on the call stack. For stack traces created from managed exceptions, this is the method where the exception occurred. It also includes other methods if they aren’t inlined.
소스 코드 줄 번호
To include file and line number information in the managed stack traces, go to Edit > Project Settings > Player > Other Settings. Then, under the Configuration heading, set the IL2CPP Stacktrace Information property to the Method Name, File Name, and Line Number setting.
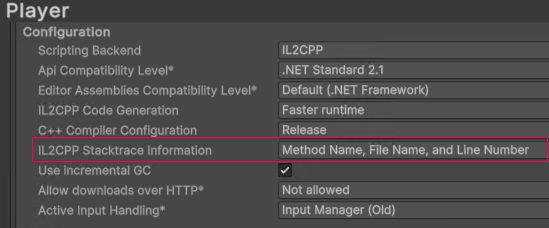
This setting instructs IL2CPP to include all managed stack frames in the call stack. Each stack frame also includes the proper C# line number, as long as a managed symbol file (.pdb) is available for the managed assembly (.dll) where that code exists.
When you enable this feature, it slightly increases both the build time and final size of the built program. The player build process includes an additional step that processes debug symbol files and generates a new data file which includes the necessary symbol formation. Unity ships this data file with the built player and uses it at runtime to determine C# line information in call stacks.
When you enable this feature, Unity generates correct call stacks in either the Release or Master configurations, even in the presence of inlining.
Script Debugging enabled
To enable Script Debugging, go to File > Build Settings and then enable the Script Debugging checkbox. When script debugging is enabled, IL2CPP reports the correct managed stack trace with the method, file, and line number. This comes at the expense of a larger program size and decreased performance.
If you only want to improve stack traces, you shouldn’t enable script debugging. Instead, enable Source code line numbers as described above.
Copyright © 2023 Unity Technologies
优美缔软件(上海)有限公司 版权所有
"Unity"、Unity 徽标及其他 Unity 商标是 Unity Technologies 或其附属机构在美国及其他地区的商标或注册商标。其他名称或品牌是其各自所有者的商标。
公安部备案号:
31010902002961