Решение проблем на iOS устройствах
There are some situations with iOS where your game can work perfectly in the Unity editor but then doesn’t work or maybe doesn’t even start on the actual device. The problems are often related to code or content quality. This section describes the most common scenarios.
Спустя некоторое время игра перестаёт отвечать. В строке состояния Xcode отображает “interrupted”.
Есть множество причин, почему это могло произойти. Обычно среди причин есть следующие:
- Ошибки скриптов, вроде неинициализированных переменных и т.п.
- Использование сторонних скомпилированных нативных библиотек Thumb. Такие библиотеки вызывают известную проблему в компоновщике iOS SDK и могут вызывать случайные крахи приложения.
- Using generic types with value types as parameters (e.g. List<int>, List<SomeStruct>, List<SomeEnum>) for serializable script properties.
- Использование рефлексии при установленном Stripping Level уровня Assembly и выше (находится в настройках проигрывателя).
- Errors in the native plugin interface (the managed code method signature does not match the native code function signature). Information from the XCode Debugger console can often help detect these problems (Xcode menu: View > Debug Area > Activate Console).
Консоль Xcode показывает “Program received signal: “SIGBUS” or EXC_BAD_ACCESS error”
This message typically appears on iOS devices when your application receives a NullReferenceException. There are two ways to figure out where the fault happened:
Трассировки стека в управляемой среде
Unity includes software-based handling of the NullReferenceException. The AOT compiler includes quick checks for null references each time a method or variable is accessed on an object. This feature affects script performance, which is why it is enabled only for development builds (enable the script debugging option in build settings dialog). If everything was done right and the fault actually is occurring in .NET code then you won’t see EXC_BAD_ACCESS anymore. Instead, the .NET exception text will be printed in the Xcode console (or else your code will just handle it in a “catch” statement). Typical output might be:
Unhandled Exception: System.NullReferenceException: A null value was found where an object instance was required.
  at DayController+$handleTimeOfDay$121+$.MoveNext () [0x0035a] in DayController.js:122
This indicates that the fault happened in the handleTimeOfDay method of the DayController class, which works as a coroutine. Also, if it is script code then you will generally be told the exact line number (e.g. “DayController.js:122”). The offending line might be something like the following:
Instantiate(_imgwww.assetBundle.mainAsset);
Это могло произойти, если, допустим, скрипт пытается получить доступ к набору ассетов (asset bundle) не проверив, правильно ли он загрузился.
Трассировки стека в нативной среде
Native stack traces are a much more powerful tool for fault investigation but using them requires some expertise. Also, you generally can’t continue after these native (hardware memory access) faults happen. To get a native stack trace, type bt all into the Xcode Debugger Console. Carefully inspect the printed stack traces; they may contain hints about where the error occurred. You might see something like:
...
Thread 1 (thread 11523):

1. 0 0x006267d0 in m_OptionsMenu_Start ()
1. 1 0x002e4160 in wrapper_runtime_invoke_object_runtime_invoke_void__this___object_intptr_intptr_intptr ()
1. 2 0x00a1dd64 in mono_jit_runtime_invoke (method=0x18b63bc, obj=0x5d10cb0, params=0x0, exc=0x2fffdd34) at /Users/mantasp/work/unity/unity-mono/External/Mono/mono/mono/mini/mini.c:4487
1. 3 0x0088481c in MonoBehaviour::InvokeMethodOrCoroutineChecked ()
...
Firstly, you should find the stack trace for “Thread 1”, which is the main thread. The very first lines of the stack trace will point to the place where the error occurred. In this example, the trace indicates that the NullReferenceException happened inside the OptionsMenu script’s Start method. Looking carefully at this method implementation would reveal the cause of the problem. Typically, NullReferenceExceptions happen inside the Start method when incorrect assumptions are made about initialization order. In some cases only a partial stack trace is seen on the Debugger Console:
Thread 1 (thread 11523):

1. 0 0x0062564c in start ()
Это означает, что нативные символы были разделены во время сборки приложения. Полную трассировку стека можно получить при помощи следующей процедуры:
- Удалите приложение с устройства.
- Очистите все targets.
- Соберите и запустите.
- Ещё раз получите трассировки стека указанным выше способом.
Когда к iOS приложению Unity подключена внешняя библиотека начинает происходить EXC_BAD_ACCESS.
This usually happens when an external library is compiled with the ARM Thumb instruction set. Currently, such libraries are not compatible with Unity. The problem can be solved easily by recompiling the library without Thumb instructions. You can do this for the library’s Xcode project with the following steps:
- In Xcode, select View > Navigators > Show Project Navigator from the menu
- Select the Unity-iPhone project, activate Build Settings tab
- In the search field enter: Other C Flags
- Add -mno-thumb flag there and rebuild the library.
Если исходный код библиотеки не доступен, то вам следует попросить у поставщика/разработчика версию библиотеки без Thumb-команд.
Консоль Xcode сообщает “WARNING -> applicationDidReceiveMemoryWarning()” и после этого приложение сразу же падает
Sometimes, you might see a message like Program received signal: “0”. This warning message is often not fatal and merely indicates that iOS is low on memory and is asking applications to free up some memory. Typically, background processes like Mail will free some memory and your application can continue to run. However, if your application continues to use memory or ask for more, the OS will eventually start killing applications and yours could be one of them. Apple does not document what memory usage is safe, but empirical observations show that applications using less than 50% of all device RAM do not have major memory usage problems. The main metric you should rely on is how much RAM your application uses. Your application memory usage consists of three major components:
- Application code (the OS needs to load and keep your application code in RAM, but some of it might be discarded if really needed)
- Native heap (used by the engine to store its state, your assets, etc. in RAM)
- Managed heap (used by your Mono runtime to keep C# objects)
- GLES driver memory pools: textures, framebuffers, compiled shaders, etc. Your application memory usage can be tracked by two Xcode Instruments tools: Activity Monitor and Allocations. You can start from the Xcode Run menu: Product > Profile and then select specific tool or via Xcode > Open Developer Tools > Instruments. Activity Monitor tool shows all process statistics including Real memory which can be regarded as the total amount of RAM used by your application. Note: OS and device HW version combination might noticeably affect memory usage numbers, so you should be careful when comparing numbers obtained on different devices.
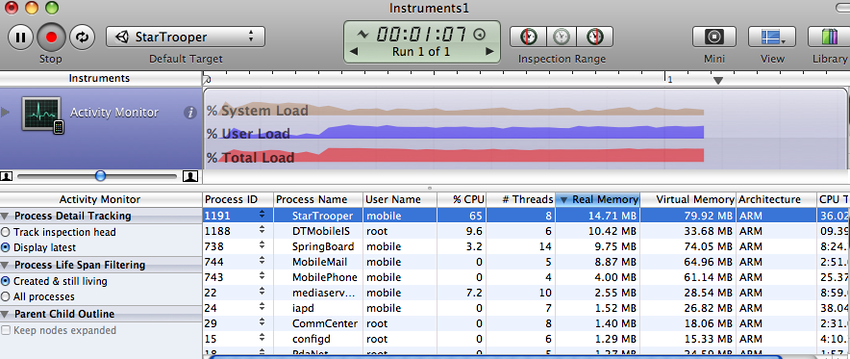
Note: The internal profiler shows only the heap allocated by .NET scripts. Total memory usage can be determined via Xcode Instruments as shown above. This figure includes parts of the application binary, some standard framework buffers, Unity engine internal state buffers, the .NET runtime heap (number printed by internal profiler), GLES driver heap and some other miscellaneous stuff.
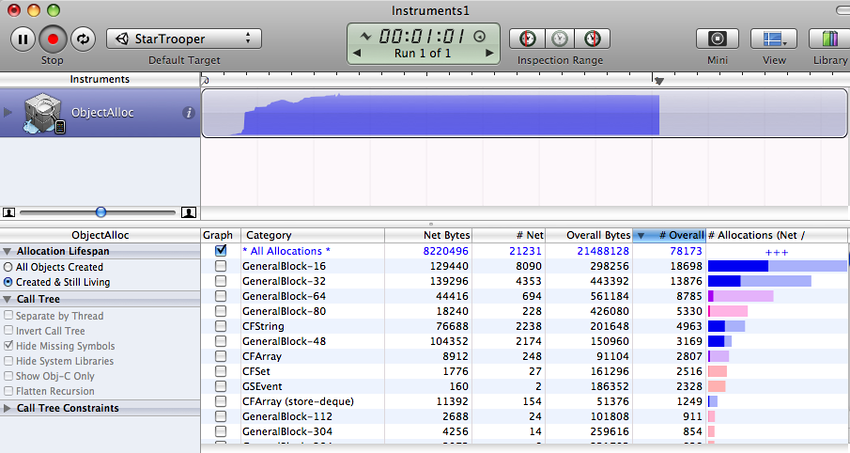
The other tool displays all allocations made by your application and includes both native heap and managed heap statistics. The important statistic is the Net bytes value.
Чтобы уменьшить потребление памяти:
- Уменьшите размер финального файла приложения, используя самые строгие iOS stripping опции (функция расширенной лицензии) и избегайте ненужных зависимостей от разных .NET библиотек. См. разделы Настройки проигрывателя и Оптимизация размера собранного iOS проигрывателя для дополнительной информации.
- Уменьшите размер вашего контента. Используйте PVRTC сжатие для текстур и используйте низкополигональные (low-poly) модели. См. уменьшение размера файла для дополнительной информации.
- Don’t allocate more memory than necessary in your scripts. Track mono heap size and usage with the internal profiler.
Запрашивание объёма свободной памяти у системы может показаться хорошей идей для изучения производительности приложения. Однако, статистика свободной памяти является ненадёжной, т.к. система использует множество динамических буферов и кэшей. Единственным надёжным вариантом является отслеживание количества памяти, потребляемое вашим приложением, и использование этого в качестве главных показателей. Обратите внимание, как с течением времени меняются графики, произведённые описанными выше инструментами, особенно после загрузки новых уровней.
При запуске из Xcode игра работает корректно, но при запуске с устройства вручную, игра падает во время загрузки первого уровня.
There could be several reasons for this. You need to inspect the device logs to get more details. Connect the device to your Mac, launch Xcode and select Window > Devices and Simulators from the menu. Select your device in the window’s left toolbar, then click on the Show the device console button and review the latest messages carefully. Additionally, you may need to investigate crash reports. You can find out how to obtain crash reports here: http://developer.apple.com/iphone/library/technotes/tn2008/tn2151.html.
Консоль Xcode Organizer содержит сообщение “killed by SpringBoard”.
Существует плохо описанный лимит времени для iOS приложения, отведённый для отрисовки его первых кадров и обработки ввода. Если ваше приложение превысит этот лимит, SpringBoard его закроет. Это может случиться, например, если первая сцена в приложении слишком большая. Чтобы избежать подобной проблемы, рекомендуется создать маленькую стартовую сцену, которая просто отображает заставку, ждёт кадр-другой при помощи yield, а затем начинает загружать саму сцену. Это можно сделать с помощью очень простого кода, например:
IEnumerator Start() {
    yield return new WaitForEndOfFrame();
// Do not forget using UnityEngine.SceneManagement directive
    SceneManager.LoadScene("Test");
}
Type.GetProperty() or Type.GetValue() cause crashes on the device
Currently Type.GetProperty() and Type.GetValue() are supported only for the .NET 2.0 Subset profile. You can select the .NET API compatibility level in the Player Settings.
На заметку: Type.GetProperty() и Type.GetValue() могут быть несовместимы со stripping’ом managed кода, что потребует их исключения (для этого во время stripping’а вы можете предоставить не подверженный ему пользовательский тип). Для дополнительной информации см. раздел Оптимизация размера собранного iOS проигрывателя.
Игра падает с ошибкой “ExecutionEngineException: Attempting to JIT compile method ‘SometType`1<SomeValueType>:.ctor ()’ while running with –aot-only.”
The Mono .NET implementation for iOS is based on AOT (ahead of time compilation to native code) technology, which has its limitations. It compiles only those generic type methods (where a value type is used as a generic parameter) which are explicitly used by other code. When such methods are used only via reflection or from native code (i.e. the serialization system) then they get skipped during AOT compilation. The AOT compiler can be hinted to include code by adding a dummy method somewhere in the script code. This can refer to the missing methods and so get them compiled ahead of time.
void _unusedMethod() {
    var tmp = new SomeType<SomeValueType>();
}
Note: Value types are basic types, enums and structs.
На устройстве могут произойти различные падения при использовании комбинации из System.Security.Cryptography и stripping’а managed кода.
Сервисы .NET криптографии сильно полагаются на рефлексию и поэтому не совместимы со stripping’ом managed кода, т.к. рефлексия включает в себя статический анализ кода. Иногда самым простым решением падений является исключение всего пространства имён System.Security.Crypography из процесса stripping’а.
The stripping process can be customized by adding a custom link.xml file to the Assets folder of your Unity project. This specifies which types and namespaces should be excluded from stripping. Further details can be found in the iOS player size optimization guide.
link.xml
<linker>
       <assembly fullname="mscorlib">
               <namespace fullname="System.Security.Cryptography" preserve="all"/>
       </assembly>
</linker>
Приложение падает при использовании System.Security.Cryptography.MD5 вместе со stripping’ом managed кода.
You should consider the above advice or try working around this problem by adding extra references to specific classes to your script code:
object obj = new MD5CryptoServiceProvider();
Ошибка среды выполнения “Ran out of trampolines of type 0/1/2”
This error usually happens if you use lots of recursive generics. You can hint to the AOT compiler to allocate more trampolines of type 0, type 1 or type 2. Additional AOT compiler command line options can be specified in the Other Settings section of the Player settings. For for type 0 trampolines specify ntrampolines=ABCD, where ABCD is the number of new trampolines required (i.e. 4096). For type 1 trampolines specify nrgctx-trampolines=ABCD and for type 2 trampolines specify nimt-trampolines=ABCD.
After upgrading Xcode Unity iOS, runtime fails with message “You are using Unity iPhone Basic. You are not allowed to remove the Unity splash screen from your game”
With some latest Xcode releases there were changes introduced in PNG compression and optimization tool. These changes might cause false positives in Unity iOS runtime checks for splash screen modifications. If you encounter such problems try upgrading Unity to the latest publicly available version. If this does not help, you might consider the following workaround:
- Замените свой проект Xcode с нуля при сборке из Unity (вместо присоединения)
- Delete already installed projects from device
- Clean project in Xcode (Product > Clean)
- Clear Xcode’s Derived Data folders (Xcode > Preferences > Locations)
Если это всё равно не помогает, то попробуйте отключить PNG пережатие в Xcode:
- Откройте свой проект Xcode
- Select Unity-iPhone project
- Select Build Settings tab
- Look for Compress PNG files option and set to NO
WWW загрузки нормально работают в редакторе Unity и на Android, но не на iOS
The most common mistake is to assume that WWW downloads are always happening on a separate thread. On some platforms this might be true, but you should not take it for granted. Best way to track WWW status is either to use the yield statement or check status in Update method. You should not use busy while loops for that.
При использовании Cocoa через нативную функцию, вызванную из скрипта, происходит ошибка “PlayerLoop called recursively!”.
Some operations with the UI will result in iOS redrawing the window immediately (the most common example is adding a UIView with a UIViewController to the main UIWindow). If you call a native function from a script, it will happen inside Unity’s PlayerLoop, resulting in PlayerLoop being called recursively. In such cases, you should consider using the performSelectorOnMainThread method with waitUntilDone set to false. It will inform iOS to schedule the operation to run between Unity’s PlayerLoop calls.
Profiler или Debugger не видит запущенную на iOS устройстве игру
- Check that you have built a Development build, and checked the Script Debugging and Autoconnect Profiler boxes (as appropriate).
- Запущенное на устройстве приложение будет вести многоадресное вещание на 225.0.0.222 с UDP портом 54997. Убедитесь, что настройки вашей сети допускают этот трафик. Затем, профайлер наладит соединение с удалённым устройством по порту в диапазоне 55000–55511 для получения информации профайлера с устройства. Эти порты должны быть открыты для UDP доступа.
Отсутствующие DLL
If your application runs ok in editor but you get errors in your iOS project this may be caused by missing DLLs (e.g. I18N.dll, I19N.West.dll). In this case, try copying those dlls from within the Unity.app to your project’s Assets\Plugins folder. The location of the DLLs within the unity app is: Unity.app\Contents\Frameworks\Mono\lib\mono\unity You should then also check the stripping level of your project to ensure the classes in the DLLs aren’t being removed when the build is optimised. Refer to the iOS Optimisation Page for more information on iOS Stripping Levels.
В консоли Xcode Debugger такое сообщение: ExecutionEngineException: Attempting to JIT compile method ‘(wrapper native-to-managed) Test:TestFunc (int)’ while running with –aot-only
Typically, such a message is received when the managed function delegate is passed to the native function, but the required wrapper code wasn’t generated when the application was built. You can help AOT compiler by hinting which methods will be passed as delegates to the native code. This can be done by adding the MonoPInvokeCallbackAttribute custom attribute. Currently, only static methods can be passed as delegates to the native code.
Образец кода:
using UnityEngine;
using System.Collections;
using System;
using System.Runtime.InteropServices;
using AOT;

public class NewBehaviourScript : MonoBehaviour {
    [DllImport ("__Internal")]
    private static extern void DoSomething (NoParamDelegate del1, StringParamDelegate del2);

    delegate void NoParamDelegate ();
    delegate void StringParamDelegate (string str);

    [MonoPInvokeCallback(typeof(NoParamDelegate))]
    public static void NoParamCallback() {
        Debug.Log ("Hello from NoParamCallback");
    }

    [MonoPInvokeCallback(typeof(StringParamDelegate))]
    public static void StringParamCallback(string str) {
        Debug.Log(string.Format("Hello from StringParamCallback {0}", str));
    }

    // Use this for initialization
    void Start() {
        DoSomething(NoParamCallback, StringParamCallback);
    }
}
Xcode выдаёт ошибку компиляции: “ld : unable to insert branch island. No insertion point available. for architecture armv7”, “clang: error: linker command failed with exit code 1 (use -v to see invocation)”
This error usually means there is just too much code in single module. Typically, it is caused by having lots of script code or having big external .NET assemblies included into build. And enabling script debugging might make things worse, because it adds quite few additional instructions to each function, so it is easier to hit that limit.
Enabling managed code stripping in player settings might help with this problem, especially if big external .NET assemblies are involved. But if the issue persists then the best solution is to split user script code into multiple assemblies. The easiest way to this is move some code to Plugins folder. Code at this location is put to a different assembly. Also, check the information about how special folder names affect script compilation.
- 2018–06–14 Page amended with limited editorial review
Copyright © 2023 Unity Technologies
优美缔软件(上海)有限公司 版权所有
"Unity"、Unity 徽标及其他 Unity 商标是 Unity Technologies 或其附属机构在美国及其他地区的商标或注册商标。其他名称或品牌是其各自所有者的商标。
公安部备案号:
31010902002961