- Unity User Manual (2019.1)
- Скриптинг
- Инструменты Скриптинга
- Console Window
Console Window
The Console Window shows errors, warnings and other messages generated by Unity.
You can also show your own messages in the Console using the Debug.Log, Debug.LogWarning and Debug.LogError functions.
To open the Console from Unity’s main menu, select Window > General > Console.

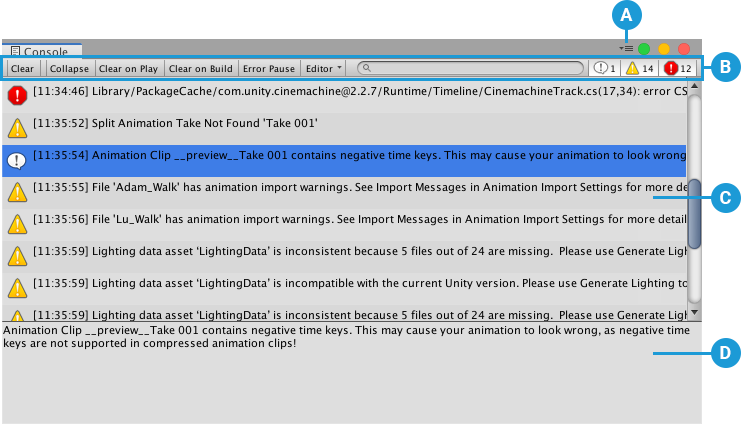
A. The Console window menu has options for opening Log files, controlling how much of each message is visible in the list, and setting stack trace options.
B. The Console toolbar has options for controlling how messages are displayed, and for searching and filtering messages.
C. The Console list displays an entry for each logged message.
Select a message to display its entire text in the detail area.You can choose how many lines of each message to display here.
See Adjusting the line count, below, for further information.
D. The detail area shows the full text of the selected message.
If stack trace is enabled, references to specific lines in code files show up as clickable links here.
Console toolbar options
The toolbar of the Console window has options for controlling how messages are displayed, and for searching and filtering messages.
| Option: | Function: | |
|---|---|---|
| Clear | Removes any messages generated from your code but retains compiler errors. | |
| Collapse | Shows only the first instance of recurring error messages. This is useful for run-time errors, such as null references, that are sometimes generated on each frame update. |
|
| Clear On Play | Clears the Console automatically whenever you enter Play mode. | |
| Clear on Build | Clears the Console when you build the Project. | |
| Error Pause | Pauses playback whenever Debug.LogError is called from a script.This is useful when you want to freeze playback at a specific point in the execution and inspect the Scene. This option does not pause playback when Debug.Log is called. |
|
| [Attach-to-Player] | Opens a drop-down menu with options for connecting to development builds that are running on remote devices, and displaying their Player logs in the Console. This option is labeled with the name of the target development build (which is the build of the log that is displayed in the Console window). If the Console is not connected to a remote build, it is labeled Editor to indicate that the log displayed in the Console window is from the local Unity Editor. |
|
| Player Logging | If the Console is connected to a remote development build, this enables Player logging for the build. Disabling this option suspends logging, but the Console remains connected to the target build. Disabling this option also hides the rest of the options in this drop-down menu. Select any build listed below Player Logging to display its log in the Console window. |
|
| Редактор | If the Console is connected to a remote development build, select this option to display the log from the local Unity Player instead of the log from the remote build. | |
| <Enter IP> | Opens the Enter Player IP dialog, where you can specify the IP address of a development build on a remote device. Click the Connect button in the dialog to connect to the build, and add it to the list of development builds at the bottom of the drop-down menu. |
|
| [DEVELOPMENT BUILDS] | Lists the available development builds. This includes auto-detected builds as well as those that you add using the Enter IP option. | |
 Messages switch Messages switch
|
Displays the number of messages in the Console. Click to show/hide messages. | |
 Warnings switch Warnings switch
|
Displays the number of warnings in the Console. Click to show/hide warnings. | |
 Errors switch Errors switch
|
Displays the number of errors in the Console. Click to show/hide errors. | |
Searching and filtering Console output
You can search Console messages for specific keywords from the Console search bar. As you type a search term, the Console filters messages to display only those that contain matching text. The Console highlights the first match in the message text when it is in the visible part of the message (see Adjusting the Line Count below). It does not highlight subsequent matches in the same message.

You can search for anything that appears in any Console message, including numerals and special characters. For example, you might want to search for the time a message was logged rather than a keyword contained in the message.
The search looks for exact matches of whatever you type in the search bar. You cannot search for two different terms at once, or use common search engine operators.
You can also filter Console message by type. Click the buttons beside the search bar to toggle:
| Button | Message type |
|---|---|
 |
Messages |
 |
Warnings |
 |
Errors |
Adjusting the line count
Each Console entry can be up to 10 lines long.
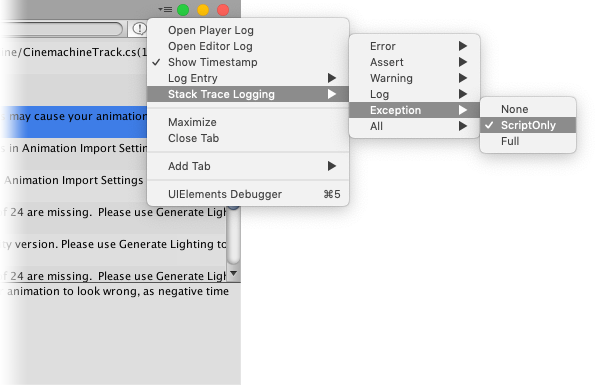
To control how many lines of each entry are visible in the list, click the Console menu button, and select Log Entry > [X] Lines from the menu, where [X] is the number of lines you wish to display for each entry.

A larger line count displays more of the text of each entry, but reduces the number of entries visible at any given time.
Line count does not affect the Console search function, which always searches the full message text. If the matching text is on a hidden line, the search returns the message in the results, but does not expand it to reveal/highlight the matching text. You can see the full message text in the detail area, but the matching text is not highlighted there.
Stack trace logging
Unity can include detailed stack trace information when it prints messages to the Console or Log file. This is useful when, for example, an error message is not very clear. In that case, the stack trace can help you determine the source of the error.
Managed vs. unmanaged stack trace
The Console can provide stack trace information for managed code and unmanaged code.
Managed code means C# scripts running in Unity. These can be scripts that ship with Unity, custom scripts that you write, third-party scripts included with an Asset store plug-in, or any other type of C# script that runs in the engine.
In some cases, you have access to managed code, and can modify it when debugging. In other cases, you don’t—for example when managed scripts are compiled into a managed .dll, you can see managed stack trace information, but you cannot modify the managed code unless you have access to the original source files.Unmanaged code means native Unity engine code, or code from a native plugin running directly on your machine, or on a target build platform.
Unmanaged code is usually compiled from C or C++ code. You cannot access it unless you have the original source code of the native binary.
In most cases, you only use the managed stack trace to help debug your C# code. However, the full stack trace can be useful in some circumstances.
For example, unmanaged stack trace can help you determine whether an error is caused by your code or the engine. It can also help you identify the area of the engine that an error originates from. This is especially useful when no managed stack trace information is available, and the error message is not very descriptive.
NOTE: Resolving a stack trace, especially a full stack trace, is a resource-intensive operation. Use these options for debugging purposes only.
Setting the stack trace type
To specify how much detail to include in the stack trace, click the Console menu button, and select Stack Trace Logging > [MESSAGE TYPE] from the menu, where [MESSAGE TYPE] is the type of message you want to include stack trace information for. Then select one of the following options:

None: Unity does not output stack trace information.
ScriptOnly: Unity outputs stack trace information for managed code.
Full: Unity outputs stack trace information for both managed and unmanaged code.
You can also control stack trace logging via scripting API. See the API reference documentation on Application.SetStackTraceLogType for more details.
Opening source files from the stack trace output
When you select a message and view the full text in the detail area at the bottom of the Console window, stack trace references to specific lines in code files become clickable links. Click any link to open the file in your IDE at the referenced line.
Opening Log files from the Console
You can open Log files from the Console window menu. Choose Open Player Log or Open Editor Log.
Obsolete API warnings and automatic updates
Among other messages, Unity shows warnings about the usage of obsolete API calls in your code. For example, Unity previously had “shortcuts” in MonoBehaviour and other classes to access common component types. So, for example, you could access a Rigidbody on the object using code like:
    // The "rigidbody" variable is part of the class and not declared in the user script.
    Vector3 v = rigidbody.velocity;
These shortcuts have been deprecated, so you should now use code like:
    // Use GetComponent to access the component.
    Rigidbody rb = GetComponent<Rigidbody>();
    Vector3 v = rb.velocity;
When the Console detects obsolete API calls, Unity shows a warning message about them. When you double-click this message, Unity automatically attempts to upgrade the deprecated usage to the recommended equivalent .
2019–03–11 Page amended with limited editorial review
Log entry line count added in 2017.3 NewIn20173
Search bar and clickable stack trace messages added in 2019.1 NewIn20191