Profiling your application
To profile your application on its target release platform, connect the target device to your network or directly to your computer via cable. You can also profile your application directly in the Unity Editor for approximate profiling results during the development of your application.
Build Settings
You can only profile your application as a Development Build. To set this up, go to Build Settings (File > Build Settings) and select your application’s target platform. Enable the Development Build setting. When you enable this setting, two settings related to the Profiler become available: Autoconnect to Profiler and Deep Profiling Support.
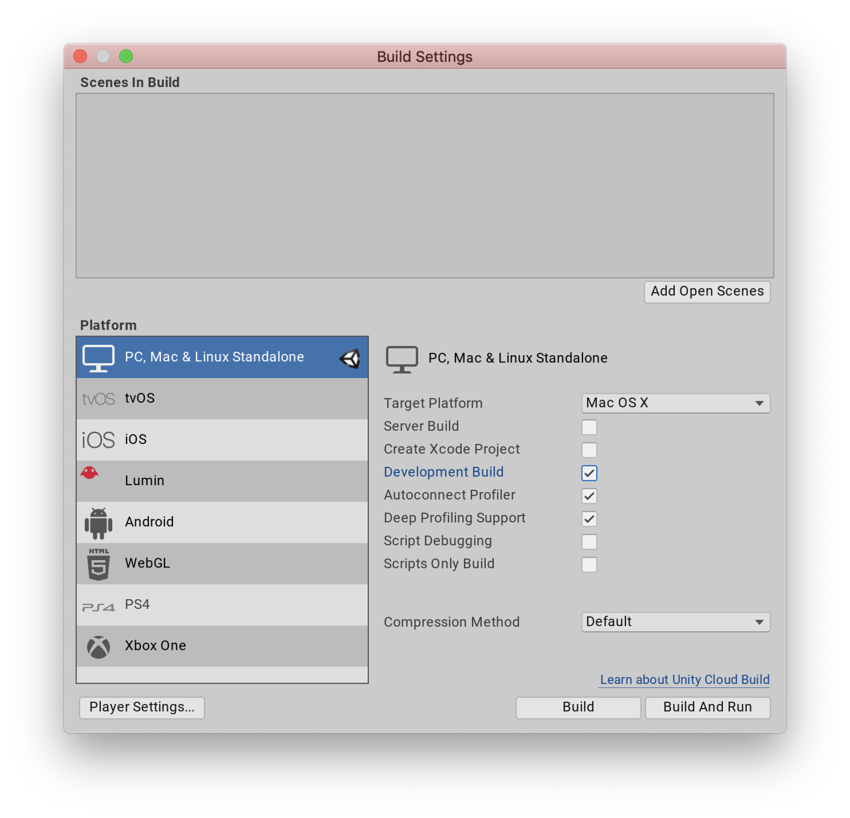
When you enable the Autoconnect Profiler setting, the Unity Editor bakes its IP address into the built Player during the build process. When you start the Player, it attempts to connect to the Profiler to the Editor located at the baked IP address.
If you additionally enable the Deep Profiling Support setting, Unity performs Deep Profiling when the built Player starts. This is useful to deep profile your application’s start up times. This adds a small amount of overhead to your build.
Connecting to your Player in the Profiler window
When you build and run your application, the player appears in the Attach to Player drop-down of the Profiler window. The Attach to Player drop-down shows all Unity Players running on your local network. You can identify these Players by player type and the hostname that is running the player (for example, iPhonePlayer (Toms iPhone)).
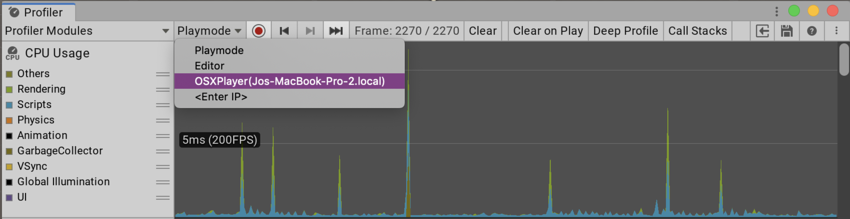
Select it and then click Record to start collecting profiling information on your application. If you enabled Autoconnect to Profiler in Build Settings, Unity automatically starts collecting data when the application starts.
To continuously collect data while your application runs, enable the Run In Background setting in Player Settings (menu: Edit > Project Settings > Player > Resolution and Presentation). When you enable this setting, the Profiler collects data even when you leave your application running in the background. If you disable it, the Profiler only collects data when the application is running in an active window.
Profiling in the Unity Editor
If you use the Profiler window to run and profile your application in the Editor, the results are only an approximation of your application’s behavior when the target platform runs it. Because Play Mode runs in the same process as the Editor, you cannot fully isolate your application’s CPU, GPU, and memory usage from Unity’s. This skews the resulting profiling data further.
To get better profiling results, you should always profile your application on a target device. Only profile in the Editor to quickly iterate over issues you have already identified on a device.
WebGL
You can use the Unity Profiler in WebGL, but you cannot attach to WebGL running players via the Editor. This is because WebGL uses WebSockets for communication, which does not allow incoming connections on the browser side. To attach to a running player, you need to enable the Autoconnect Profiler checkbox in Build Settings (menu: File > Build Settings). Unity cannot profile draw calls for WebGL.
Profiling on mobile devices
Both iOS and Android devices support remote profiling over a network. If you are using a firewall, open ports 54998 to 55511 in your firewall’s outbound rules. These are the ports Unity uses for remote profiling.
Note: Sometimes, when you set up remote profiling, the Unity Editor might not auto-connect to the device. If this happens, you can initiate the Profiler connection manually. To do this, select the Attach to Player drop-down menu in the Profiler window and choose the appropriate device.
You can also plug the target device directly into your computer, to avoid network or connection issues.
iOS remote profiling
To enable remote profiling on iOS devices, follow these steps:
- Connect your iOS device to your WiFi network. The Profiler uses a local WiFi network to send profiling data from your device to the Unity Editor.
- Attach your device to your computer via cable. Go to the Build Settings (menu: File > Build Settings), enable the Development Build and Autoconnect Profiler checkboxes, then select Build & Run.
- When the application launches on the device, open the Profiler window in the Unity Editor (menu: Window > Analysis > Profiler).
Android remote profiling
Android devices support two methods of remote profiling: via WiFi or through Android Debug Bridge (adb).
Следуйте этим шагам для профайлинга через WiFi:
- Disable mobile data on your Android device.
- Connect your Android device to your WiFi network. The Profiler uses a local WiFi network to send profiling data from your device to the Unity Editor.
- Attach your device to your computer via cable. Go to the Build Settings (menu: File > Build Settings), enable the Development Build and Autoconnect Profiler checkboxes, then select Build & Run.
- When the application launches on the device, open the Profiler window in the Unity Editor (menu: Window > Analysis > Profiler).
Note: The Android device and host computer that is running the Unity Editor must both be on the same subnet for device detection to work.
For Android Debug Bridge (adb) profiling, follow these steps:
- Attach your device to your computer via cable and make sure that it shows in the adb devices list.
- Go to the Build Settings (menu: File > Build Settings), enable the Development Build checkbox, and then select Build & Run
- When the application launches on the device, open the Profiler window in the Unity Editor (menu: Window > Analysis > Profiler).
- From the Attach to Player drop-down menu, select AndroidProfiler(ADB@127.0.0.1:34999). The entry in the drop-down menu is only visible when the selected target is Android.
The Unity Editor automatically creates an adb tunnel for your application when you select Build & Run. If you want to profile another application, or you restart the adb server, you have to configure this tunnel manually. To do this, open a Terminal window or CMD prompt and enter:
adb forward tcp:34999 localabstract:Unity-{insert bundle identifier here}
To use Deep Profiling with an Android build, you need to enable the Mono Scripting Backend setting in the Android Player Settings (menu: Edit > Project Settings > Player > Android > Other Settings) and enter the following to start the game through an adb command:
~$ adb shell am start -n {insert bundle identifier here}/com.unity3d.player.UnityPlayerActivity -e 'unity' '-deepprofiling'
- Added Deep Profiling Support in 2019.3 NewIn20193
Copyright © 2023 Unity Technologies
优美缔软件(上海)有限公司 版权所有
"Unity"、Unity 徽标及其他 Unity 商标是 Unity Technologies 或其附属机构在美国及其他地区的商标或注册商标。其他名称或品牌是其各自所有者的商标。
公安部备案号:
31010902002961