Overview page
The Overview page of your Unity Analytics Dashboard provides a number of predefined charts that track commonly used metrics and key performance indicators. The overview page presents the charts in the following sections:
| Active Players | Shows how many players start to play your game as well as return to it over time. |
| Sessions | Shows how often and how long the average player plays your game each day. |
| Retention | Shows the percentage of players who return to the game at significant intervals. |
| Revenue | Shows reported, verified In-App Purchase (IAP) and Unity Ads revenue. |
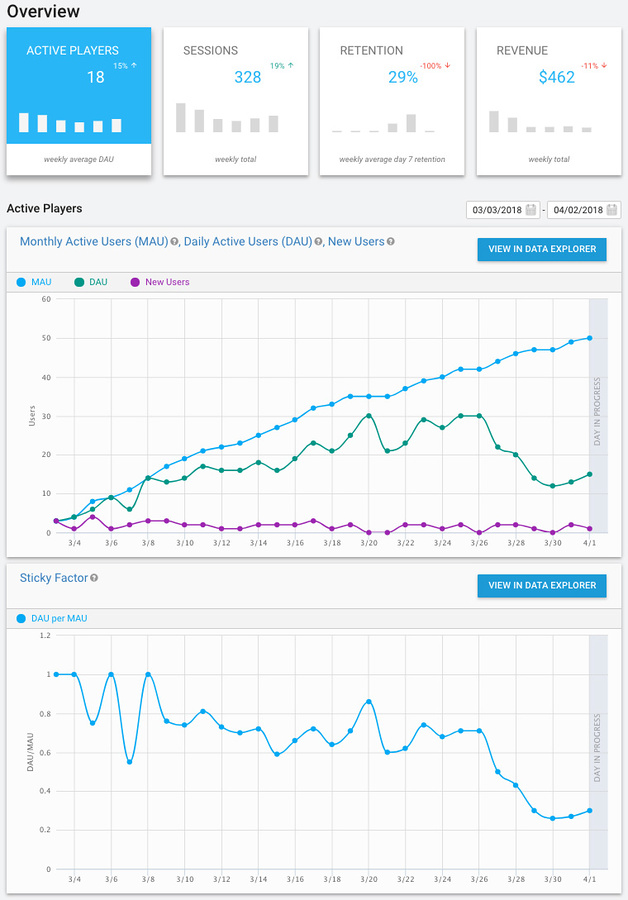
For each chart displayed in these sections, you can select the date range to display. You can also click the View in Data Explorer button to view the report in the DataExplorer tab where you have many more options for selecting, formatting, and analyzing report data.
For more information about the metrics used on the Overview page and elsewhere on the Analytics Dashboard, see Analytics Metrics, Segments, and Terminology.
- 2017–08–29 Page published
- New feature in Unity 2017.1
Copyright © 2023 Unity Technologies
优美缔软件(上海)有限公司 版权所有
"Unity"、Unity 徽标及其他 Unity 商标是 Unity Technologies 或其附属机构在美国及其他地区的商标或注册商标。其他名称或品牌是其各自所有者的商标。
公安部备案号:
31010902002961