Collect performance data in Play mode
Profile in Play mode to quickly test changes and monitor the performance of your application without having to rebuild your application every time.
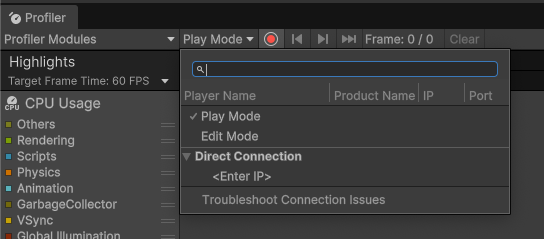
To profile in Play mode:
- Open the Profiler (Window > Analysis > Profiler)
- Select the Target Selection dropdown, next to Record
- Select Play Mode
Tip: Whenever you profile Play mode, open it in a maximized view to run your application at a resolution closer to that of your target device. This directly affects performance issues such as those related to fill rate.
To make sure that windows other than Play mode or the ProfilerA window that helps you to optimize your game. It shows how much time is spent in the various areas of your game. For example, it can report the percentage of time spent rendering, animating, or in your game logic. More info
See in Glossary don’t use up time on the render thread and GPU, which affects performance data, reduce the amount of open Unity Editor windows.
Additional resources
Copyright © 2023 Unity Technologies
优美缔软件(上海)有限公司 版权所有
"Unity"、Unity 徽标及其他 Unity 商标是 Unity Technologies 或其附属机构在美国及其他地区的商标或注册商标。其他名称或品牌是其各自所有者的商标。
公安部备案号:
31010902002961