Profiler modules introduction
Collect specific performance data about your application with ProfilerA window that helps you to optimize your game. It shows how much time is spent in the various areas of your game. For example, it can report the percentage of time spent rendering, animating, or in your game logic. More info
See in Glossary modules.
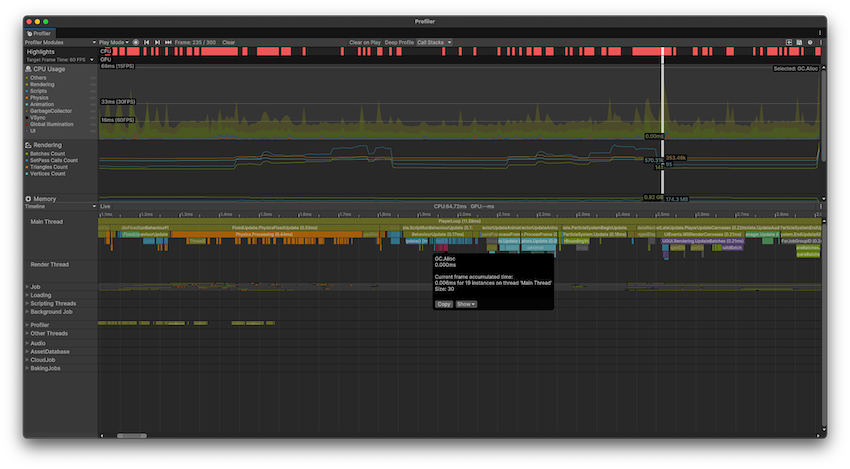
The top area of the Profiler window contains Profiler modules that profile specific areas of your application. When you profile your application, Unity displays the data related to each module in corresponding charts.

Module types
The CPU Usage module provides an overview of how much time your application spends on each frame. The other modules collect data which you can use to inspect specific areas or to monitor the vitals of your application, such as memory consumption, rendering, or audio statistics.
Each module has its own chart. When you select a module, the details panel in the bottom section of the Profiler window displays detailed data that the module collects. You can then use this data to identify areas of improvement in your application.
For a full list of available Profiler modules refer to the Profiler window reference.
Custom Profiler modules
You can add your own Profiler modules to the Profiler window to capture and visualize specific performance data in your application. You can either use the Profiler Module Editor or use scriptsA piece of code that allows you to create your own Components, trigger game events, modify Component properties over time and respond to user input in any way you like. More info
See in Glossary to automatically create and populate modules.
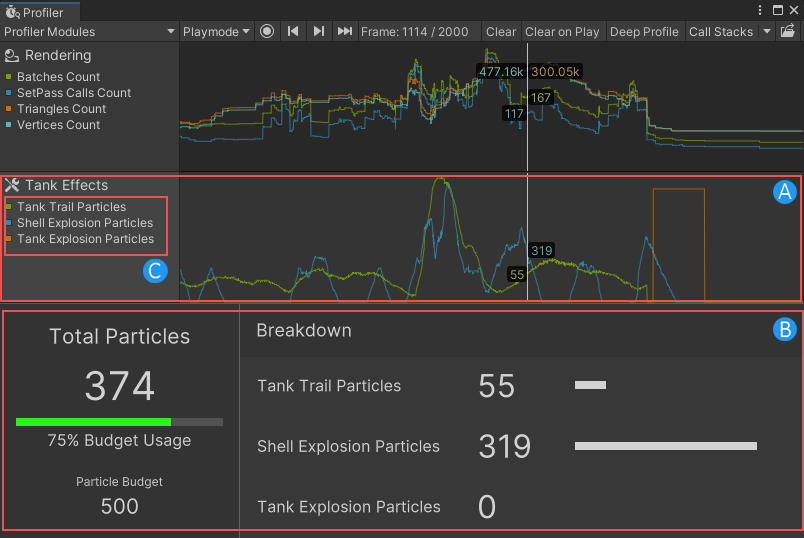
The following image of a customized Profiler window contains:
A: A custom Profiler module named Tank Effects.
B: A custom module details panel that visualizes the data in the Tank Effects profiler module.

For more information, refer to Customizing Profiler modules.