CPU Usage Profiler 模块
CPU Usage Profiler 模块包含一个图表,其中显示应用程序中的时间花费情况。通过该图表可以概要了解应用程序花费时间的所有重要方面(例如渲染、脚本和动画)。文档的此部分涵盖:
图表类别
CPU Usage Profiler 模块的图表可跟踪应用程序主线程中花费的时间。这些时间被分为九个类别。要更改图表中类别的顺序,可以在图表的图例中拖放这些类别。还可以单击某个类别的有色图例以切换是否显示。
| 类别 | 描述 |
|---|---|
| Rendering | 应用程序花费多少时间来渲染图形。 |
| Scripts | 应用程序花费多少时间来运行脚本。 |
| Physics | 应用程序在物理引擎上花费多少时间。 |
| 动画 | 应用程序花费多少时间来动画化应用程序中带蒙皮的网格渲染器 (Skinned Mesh Renderers)、游戏对象和其他组件。这还包括针对 Animation 组件和 Animator 组件所用的系统进行计算所花费的时间。 |
| GarbageCollector | 应用程序花费多少时间来运行垃圾回收器。 |
| VSync | 应用程序每帧花费多少时间来等待 targetFrameRate 或下一个要同步的 VBlank。此时间基于 QualitySettings.vSyncCount 值、目标帧率或者 VSync 设置(即运行应用程序的平台的默认或强制最大值)。有关 VSync 的更多信息,请参阅本文档中的渲染和 VSync 样本部分。 |
| Global Illumination | 应用程序在光照中花费多少时间。 |
| UI | 应用程序花费多少时间来显示其 UI。 |
| Others | 应用程序在不属于任何其他类别的代码中花费多少时间。此事件包括整个 EditorLoop 或者是 Editor 中对运行模式进行性能分析时的性能分析开销等方面。 |
模块详细信息面板
选择 CPU Usage 模块时,下面的详细信息面板将显示应用程序在选定帧内花费的时间的细分信息。可以将时间数据显示为时间轴或层级表。要更改显示视图,请使用详细信息面板中的左上角下拉选单(默认设置为 __Timeline__)。三个可用视图为:
| 视图 | 功能 |
|---|---|
| Timeline | 显示特定帧的时间细分信息,以及该帧长度的时间轴。只有在此视图模式中才可以一次性查看所有线程上的时间以及在帧内运行线程的时间,因此可以关联各个线程的时间(例如作业系统工作线程在主线程上的系统调度这些线程之后启动)。 |
| Hierarchy | 按时间数据的内部层级结构对这些数据分组。此选项以降序列表格式显示应用程序调用的元素,默认按花费的时间排序。还可以按分配的脚本内存量 (GC Alloc) 或调用次数对信息进行排序。要更改用于对表进行排序的列,请单击该表列的标题。 |
| Raw Hierarchy | 以类似于发生计时的调用栈的层级结构显示时间数据。Unity 在此模式中单独列出每个调用栈,而不是像在 Hierarchy 视图中一样将它们合并。 |
Live 设置
当您开始在运行模式 (Playmode) 或 Editor 中记录新数据时,__Live__ 设置(在每个视图中都可用)可在模块详细信息面板中显示有关当前帧或选定帧的信息。为了启用此设置,请单击模块详细信息下拉选单旁的 Live 按钮。默认情况下,此设置已禁用,并且在您记录数据时模块详细信息面板为空白。注意:重绘 Profiler 窗口时,此设置会增加 EditorLoop 的开销。
Show Full Scripting Method Names 设置
此外,在每个视图中,可以选择 More Items 菜单 (⋮) 并启用 __Show Full Scripting Method Names__,此设置随后显示所有脚本方法的完全限定名称 (Assembly::Class::MethodName)。

B:已启用 Show Full Scripting Method Names 的情况下,Hierarchy 视图和 Timeline 视图中的脚本方法
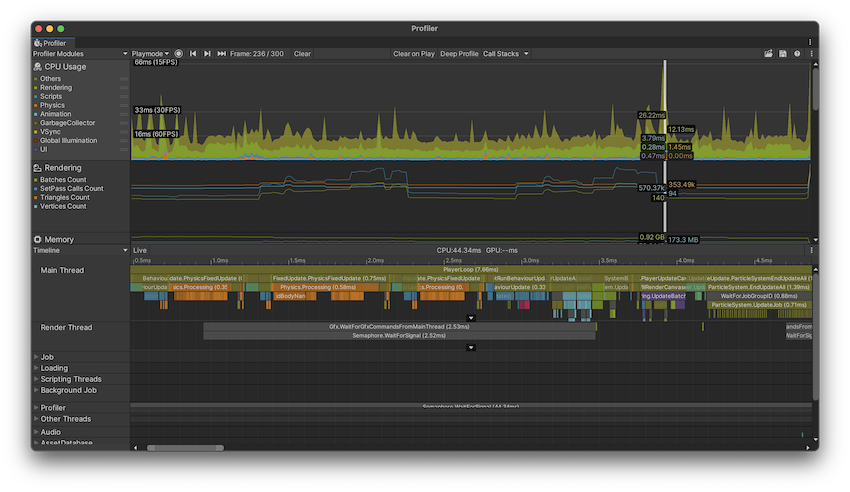
Timeline 视图

The Timeline view is the default view for the CPU Usage Profiler module. It contains an overview of where time is spent in your application and how the timings relate to each other.
与 Hierarchy 视图不同,Timeline 视图沿同一时间轴在各自子部分中显示所有线程的性能分析数据。Hierarchy 视图一次只显示一个线程(默认显示主线程)的性能分析数据。此外,这些视图仅显示样本的持续时间,而 Timeline 视图会显示每个样本发生的时间。
使用 Timeline 视图可以查看不同线程上的活动在并行执行过程中如何相互关联。在此处可以了解对不同线程(例如作业系统的工作线程)的使用程度、线程上工作的排队方式以及任何线程是处于空闲状态(Idle 样本)还是在等待另一线程或作业完成(Wait for x 样本)。
导航和选择项目
要放大时间轴的区域,请使用鼠标上的滚轮,或在按住 Alt 键的同时按住鼠标右键进行拖动。也可以使用水平滚动条的两端来放大。按下键盘上的 A 键可重置缩放,以便可看到整个帧时间。
每当在线程底部看到白色箭头时,都可以单击该箭头来展开线程以便显示所有行,或者再次单击以便仅显示顶部的行。也可以拖动分隔线程的行以重新调整可看到的行数。双击该行可将线程部分的高度设置为调用栈的最大深度。要平移视图,请按鼠标中键,或按住 Alt 键(在 macOS 上为 Command 键),然后按鼠标左键。
要折叠和展开线程组,请单击视图最左侧的线程名称旁的折叠箭头。
要查看某一项对 CPU 图表的贡献,请在下方面板中选择这一项。性能分析器会突出显示该项的贡献,并使图表的其余部分变暗。要取消选择该项,请单击视图中的其他位置。按 F 键可以聚焦所选的当前样本,或者如果未选择任何项,则会显示默认的缩放水平。

In the image above, the tooltip on the selected sample provides further details, such as the number of instances and the total time of this sample across all threads. You can select the text within the tooltip and copy it as well as use the buttons to interact with the sample further:
| Operation | 描述 |
|---|---|
| Copy | Copy the call stack and the entire content of the tooltip to your clipboard. |
| Show | Select this dropdown to choose from the following options: |
| Hierarchy | Switch to this sample in Hierarchy view |
| Raw Hierarchy | Switch to this sample in Raw Hierarchy view |
| Full Details for Call Stacks | Unity records call stacks as a list of method pointer addresses, which it uses to display the method name, file path, and line number of the stack. Whenever only the pointer address is present, Unity ignores it to conserve screen space for the actionable items that have further information available. Enable this property to see the full list of method pointer addresses of the call stack. |
| Selected Sample Stack | View the details of the sample stack. Unity opens this information in a separate window. You can then copy the sample stack information to your clipboard. The sample stack differs from a method’s call stack because Unity does not tie every sample to a specific method, nor does it record every call as a sample. If you select a sample in a different frame and there isn’t a sample with the same sample stack in the displayed frame, this window shows both the sample stack of the original selection, as well as the approximate selection for this frame. |
GC.Alloc samples appear colored in red-magenta, and show you the size of the allocation.
要在工具提示中显示托管的调用栈,请导航到 Profiler 窗口的工具栏,然后选择 Call Stacks 按钮。必须先启用此属性,然后对帧进行性能分析以显示帧的调用栈。有关更多信息,请参阅关于调用栈的部分。
Flow Events
为了帮助您直观地了解 Unity 如何跨线程调度作业,您可以使用 Flow Events 设置。此设置显示系统、作业和线程之间的关系。要启用此设置,请选择 Timeline 视图窗格的右上角的 More menu (⋮) ,然后选择 Show Flow Events。
启用此设置后,性能分析器会将白色事件标记添加到用于调度作业或等待调度作业完成的性能分析器样本。它还会使不相关的样本变暗,以便您可以更容易地看到您选择的样本。
性能分析器将三种类型的箭头添加到样本中:
- 向下箭头:指示流程的开始,并且此样本调度了某些工作。
- 向右箭头:指示流程中的下一个项目,并且另一个样本调度了此工作。
- 向上箭头:指示流程的结束,以及此样本上的工作已结束或同步。
当您选择一个样本时,Profiler 将相关的流程事件标记用线条连接在一起。粗线条突出显示您选择的特定流程。例如,如果一个 begin 样本指向另外两个 next 样本,当您单击 next 样本之一时,性能分析器会为其绘制一条较粗的线条。
此视图有助于发现代码的执行流程、等待完成的工作,并帮助您以直观方式发现代码的依赖关系。

Hierarchy 和 Raw Hierarchy 视图
切换到 Hierarchy 或 Raw Hierarchy 视图时,只要样本在主线程上,您所做的选择就会继续存在。如果无法立即找到您的选择,请按 F 键进行聚焦。
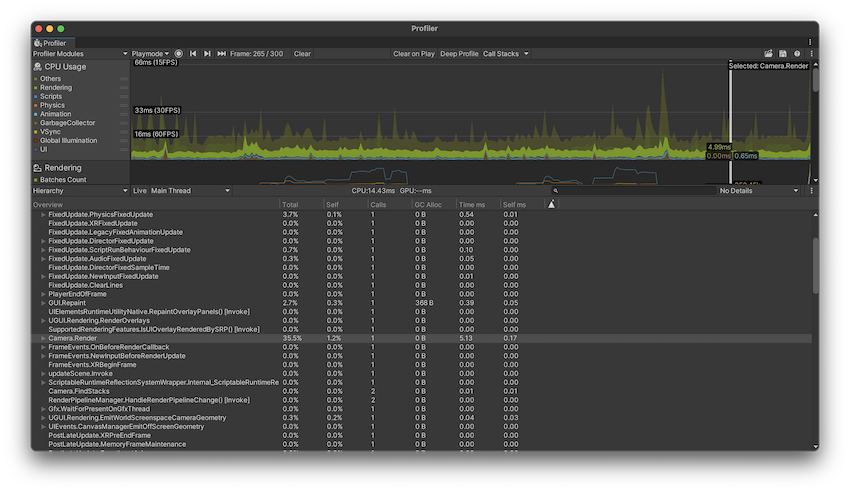
Hierarchy 视图列出已进行性能分析的所有样本,并按共享的调用栈和 ProfilerMarker 层级视图将样本一起分组。Raw Hierarchy 视图不会将样本一起分组,因此非常适合在粒度级别上查看样本。也可以使用 Thread 下拉选单来选择特定线程,例如要在这些视图中检查的主线程 (Main Thread) 或渲染线程 (Render Thread)。
默认情况下,在这些视图中,所有 EditorOnly 样本都是折叠状态。EditorOnly 样本是玩家循环 (Player Loop) 中仅由于“仅 Editor”安全性检查而发生的样本。样本折叠后,它们的 GC.Alloc 值不会影响所属样本的 GC.Alloc 值。要显示这些样本,请选择详细信息面板右上角的 More Items 菜单 (⋮),然后禁用 Collapse EditorOnly Samples 设置。有关更多信息,请参阅本文档的仅 Editor 样本部分。
这两个视图都会在 Hierarchy 中每行旁边显示有关每一项的以下详细信息:
| 属性 | 功能 |
|---|---|
| Total | Unity 在特定函数上花费的总时间(以百分比表示)。 |
| Self | Unity 在特定函数上花费的总时间(以百分比表示),不包括 Unity 在调用子函数时花费的时间。 例如,在截屏中,16.7% 的时间用在了 Camera.Render 函数上。这是因为该函数调用了许多绘制和剔除函数。但是,排除调用的函数后,只有 0.2% 的时间花费在 Camera.Render 函数本身上。 |
| Calls | 此帧中调用此函数的次数。在 Raw Hierarchy 视图中,此列中的值始终为 1,因为性能分析器不会合并样本的层级视图。 |
| GC Alloc | How much scripting heap memory Unity has allocated in the current frame. The garbage collector manages the scripting heap memory. Whenever Unity calls GC.Collect() or there is a scripting heap allocation that does not fit within the heap’s current size, the garbage collector triggers. It marks all allocations that have no more references to them and collects them. This process appears as GC.Collect samples in the Profiler. Unity runs the garbage collector more frequently as your application allocates more on the heap. As the managed heap grows, it takes Unity longer to mark and collect the memory. As such, you should keep the GC Alloc value at zero while your application runs, to prevent the garbage collector from affecting your application’s framerate, and to keep the overall heap size small. For more details about the managed heap see the documentation on Understanding Automatic Memory Management. |
| Time ms | Unity 在特定函数上花费的总时间(以毫秒为单位)。如果应用程序使用作业系统或多线程渲染,则此信息可能会产生误导,因为它仅包含 Unity 在当前选定线程上花费的时间。要更改线程,请选择 Hierarchy 面板顶部的 Thread 下拉选单。 |
| Self ms | Unity 在特定函数上花费的总时间(以毫秒为单位),不包括 Unity 在调用子函数时花费的时间。 |
| Warning | 由警告图标指示,此处显示应用程序在当前帧中触发警告的次数。有关更多信息,请参阅本文档的性能警告部分。 |
要进一步了解应用程序在何处调用和使用了接受性能分析的函数,请选择模块详细信息面板右上角的 Details 下拉选单,然后选择 Related Data 或 Calls 视图。

Related Data 视图显示一个 UnityEngine.Objects 列表;此列表中的对象使用 Begin() 重载,而且与性能分析器样本关联。Unity 报告的某些样本内置了这些关联性,例如,已链接到执行渲染的摄像机游戏对象的 Camera.Render 样本。如果在 Editor 中进行性能分析,Unity 将通过这些对象的实例 ID 来报告这些对象,并在 Profiler 窗口中将它们解析为名称。对构建的播放器进行性能分析或从磁盘加载捕获的数据时,这些名称不会显示,并且性能分析器将这些名称显示为 N/A。
单击这些对象之一时,Unity 尝试通过 Scene 层级视图来查找此对象,然后对此对象进行 ping 操作。因为此关联性使用实例 ID,所以只有在 Editor 中对应用程序进行性能分析并且该对象仍然存在的情况下,ping 操作才有效。
对于 GC.Alloc 样本,此视图会显示 N/A 项的列表;在此层级视图级别发生的每个分配都有一个对应的项,并且会在 GC.Alloc 列中列出此分配的大小。如果在已启用 Call Stacks 设置的情况下对应用程序进行性能分析,则在此视图中选择 GC.Alloc 样本时,Profiler 窗口将显示选定的所分配脚本对象的调用栈(即使未启用 Deep Profiling 设置)。有关更多信息,请参阅本文档的分配调用栈部分。
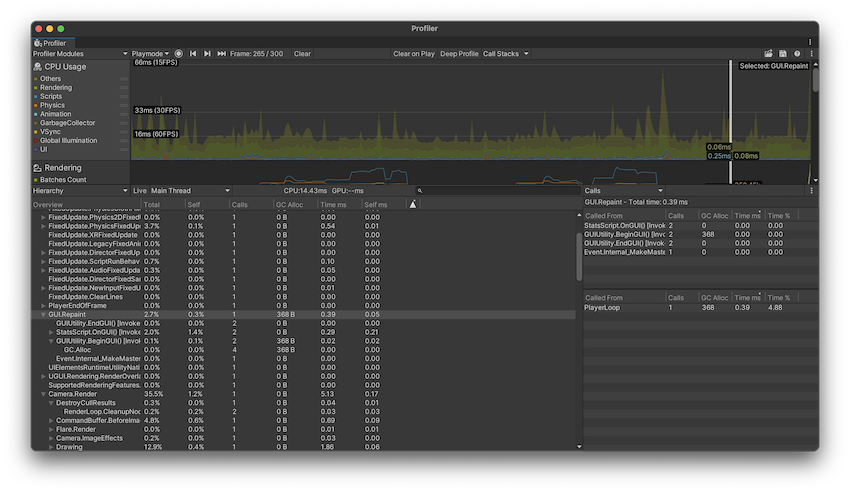
The Calls view displays where the selected sample is being called from as well as what other functions it calls to.
调用栈
ProfilerMarkers emit a set of samples which the Profiler uses to display and organize profiling information into different chronological and hierarchical views. Any sample displayed in the Profiler window is therefore part of a sample stack.
A sample stack differs from a method’s call stack because Unity does not tie every sample to a specific method, nor does it record every call as a sample. Deep Profiling adds a ProfilerMarker to every function call, but it does not add any for native code, plus recording all of these samples comes with a potentially high overhead.
您可以为 GC.Alloc、UnsafeUtility.Malloc、JobHandle.Complete 发出的样本启用完整的调用栈。如果您希望在不启用深度性能分析并避免较大开销的情况下跟踪这些样本的发生位置,这将非常有用。有关这些标记的更多信息,请参阅有关常见性能分析器标记的文档。
To enable full call stacks for these samples, navigate to the toolbar of the Profiler window and enable the Call Stacks button. By default, this enables the call stacks for GC.Alloc samples. To enable other call stacks, select the dropdown arrow and enable any of the other markers you would like to see the call stacks for.
无论是在编辑器中还是在运行的播放器中进行性能分析,都可以使用此功能。此功能仅在您打开此选项后才会对进行性能分析的框架生效。
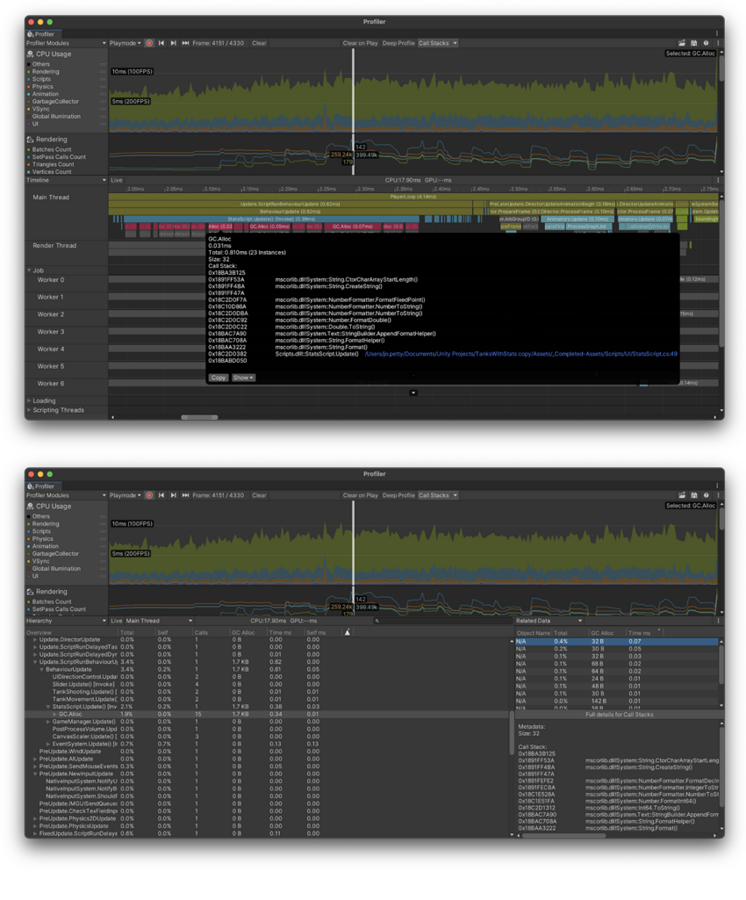
For example, every scripting heap allocation shows up as a GC.Alloc sample in both the Hierarchy view and Timeline view. In the Timeline view, it is colored bright magenta. To see a call stack, select the CPU Profiler module and then select a GC.Alloc sample in Timeline view. The call stack appears in the selection highlight.
To copy the call stack, select the Copy button in the tooltip. You can also open the relevant code file from this view if the file path is highlighted as a blue link. Click on the link and the file opens in your default IDE. Note: The call stack information does not contain the exact line number within that method but just the line at the beginning of that method.
You can also use the Show dropdown to see the GC.Alloc’s sample stack, its full details, or switch to view it in the Hierarchy or Raw Hierarchy view.
要查看完整的调用栈详细信息,请在 Hierarchy 或 Raw Hierarchy 视图中将 Details 视图设置为 Related Data。此视图列出了与此样本关联的元数据,其中可能包括与之相关联的 UnityEngine.Object。对于任何不与 UnityEngine.Object 关联的元数据条目,该名称在此面板中显示为 N/A。选择 N/A 条目时,性能分析器会在 Details 视图的下半部分中显示元数据,包括调用栈。
For more information about managed allocations, see documentation on Understanding Automatic Memory Management.
常用标记
Unity 的代码配备了大量性能分析器标记,可用于深入了解应用程序中占用时间的内容。有关您可能在性能分析数据中看到的最常见标记的完整列表,请参阅有关常用性能分析器标记 的文档。
Copyright © 2023 Unity Technologies
优美缔软件(上海)有限公司 版权所有
"Unity"、Unity 徽标及其他 Unity 商标是 Unity Technologies 或其附属机构在美国及其他地区的商标或注册商标。其他名称或品牌是其各自所有者的商标。
公安部备案号:
31010902002961