CPU Usage Profiler module
CPU Usage Profiler 模块包含一个图表,其中显示应用程序中的时间花费情况。通过该图表可以概要了解应用程序花费时间的所有重要方面(例如渲染、脚本和动画)。文档的此部分涵盖:
图表类别
CPU Usage Profiler 模块的图表可跟踪应用程序主线程中花费的时间。这些时间被分为九个类别。要更改图表中类别的顺序,可以在图表的图例中拖放这些类别。还可以单击某个类别的有色图例以切换是否显示。

| 类别 | 描述 |
|---|---|
| Rendering | 应用程序花费多少时间来渲染图形。 |
| Scripts | 应用程序花费多少时间来运行脚本。 |
| Physics | 应用程序在物理引擎上花费多少时间。 |
| 动画 | 应用程序花费多少时间来动画化应用程序中带蒙皮的网格渲染器 (Skinned Mesh Renderers)、游戏对象和其他组件。这还包括针对 Animation 组件和 Animator 组件所用的系统进行计算所花费的时间。 |
| GarbageCollector | 应用程序花费多少时间来运行垃圾回收器。 |
| VSync | 应用程序每帧花费多少时间来等待 targetFrameRate 或下一个要同步的 VBlank。此时间基于 QualitySettings.vSyncCount 值、目标帧率或者 VSync 设置(即运行应用程序的平台的默认或强制最大值)。有关 VSync 的更多信息,请参阅本文档中的渲染和 VSync 样本部分。 |
| Global Illumination | 应用程序在光照中花费多少时间。 |
| UI | How much time your application spends on displaying your its UI. |
| Others | How much time your application spends on code that does not fall into any of the other categories. This includes areas like the entire EditorLoop, or the Profiling overhead when profiling Play Mode in the Editor. |
模块详细信息面板
When you select the CPU Usage module, the details pane below it displays a breakdown of where the application spent time in the selected frame. You can display the timing data as either a timeline or a hierarchical table; to change the display, use the top-left dropdown in the details pane (set to Timeline by default). The three views available are:
| 视图 | 功能 |
|---|---|
| Timeline | Displays a breakdown of the timings for a particular frame, alongside a time axis of the frame’s length. This is the only view mode that you can use to see timings on threads other than the main thread, and correlate timings across threads (for example, Job System worker threads starting up after a system on the main thread schedules them). |
| Hierarchy | GGroups the timing data by its internal hierarchical structure. This option displays the elements that your application called in a descending list format, ordered by the time spent by default. You can also order the information by the amount of scripting memory allocated (GC Alloc), or the number of calls. To change the column that orders the table, click the table column’s header. |
| Raw Hierarchy | 以类似于发生计时的调用栈的层级结构显示时间数据。Unity 在此模式中单独列出每个调用栈,而不是像在 Hierarchy 视图中一样将它们合并。 |
Timeline view
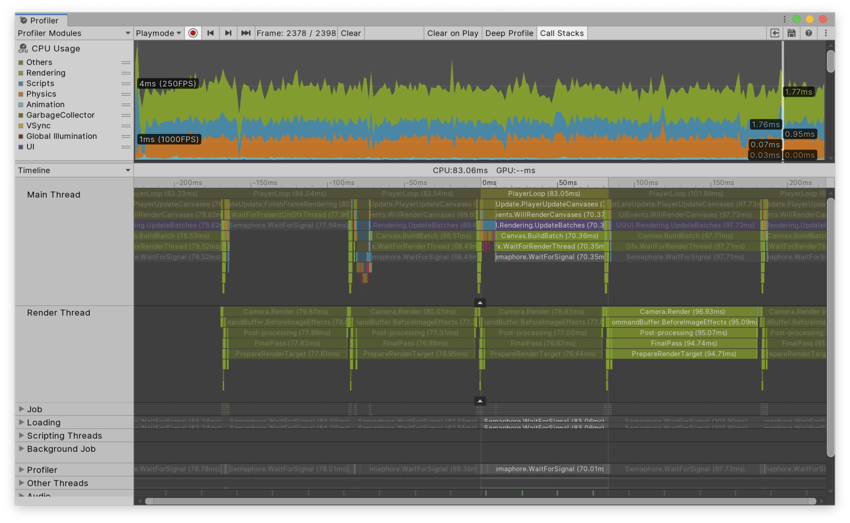
The Timeline view is the default view for the CPU Usage Profiler module. It contains an overview of where time is spent in your application and how the timings relate to each other. The Timeline view displays profiling data from all threads in their own own subsections and along the same time axis. This is unlike the Hierarchy views, which only show profiling data from the main thread.
使用 Timeline 视图可以查看不同线程上的活动在并行执行过程中如何相互关联。在此处可以了解对不同线程(例如作业系统的工作线程)的使用程度、线程上工作的排队方式以及任何线程是处于空闲状态(__Idle__ 样本)还是在等待另一线程或作业完成(__Wait for x__ 样本)。
Navigating and selecting items
To zoom in on areas of the time axis, use the scroll wheel on your mouse, or press and hold the Alt key while you drag with the right mouse button pressed down. You can also use the ends of the horizontal scrollbar to zoom in. Press the A key on your keyboard to reset the zoom so that the entire frame time is visible.
每当在线程底部看到白色箭头时,都可以单击该箭头来展开线程以便显示所有行,或者再次单击以便仅显示顶部的行。也可以拖动分隔线程的行以重新调整可看到的行数。双击该行可将线程部分的高度设置为调用栈的最大深度。要平移视图,请按鼠标中键,或按住 Alt 键(在 macOS 上为 Command 键),然后按鼠标左键。
要折叠和展开线程组,请单击视图最左侧的线程名称旁的折叠箭头。
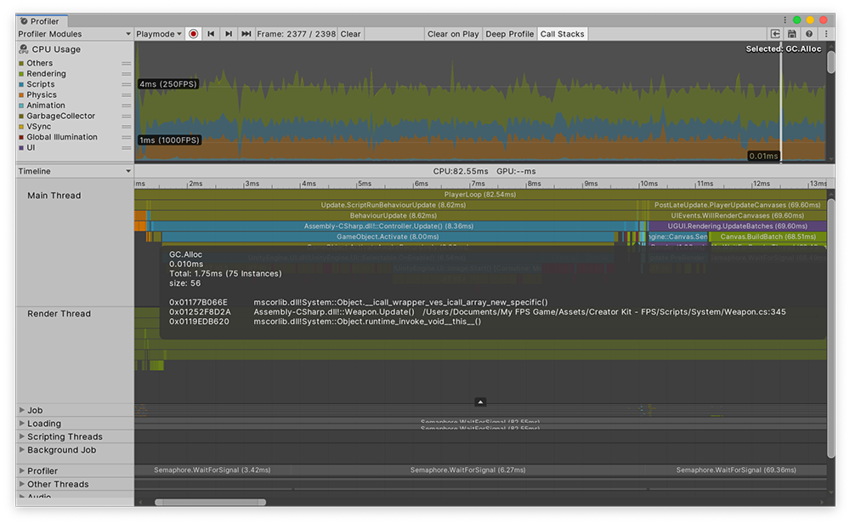
To see an item’s contribution to the CPU chart, select it in the lower pane. The Profiler highlights its contribution, and dims the rest of the chart. To deselect the item, click elsewhere in the view. Press the F key to focus the current sample you selected, or to show the default zoom level if you’ve selected nothing.
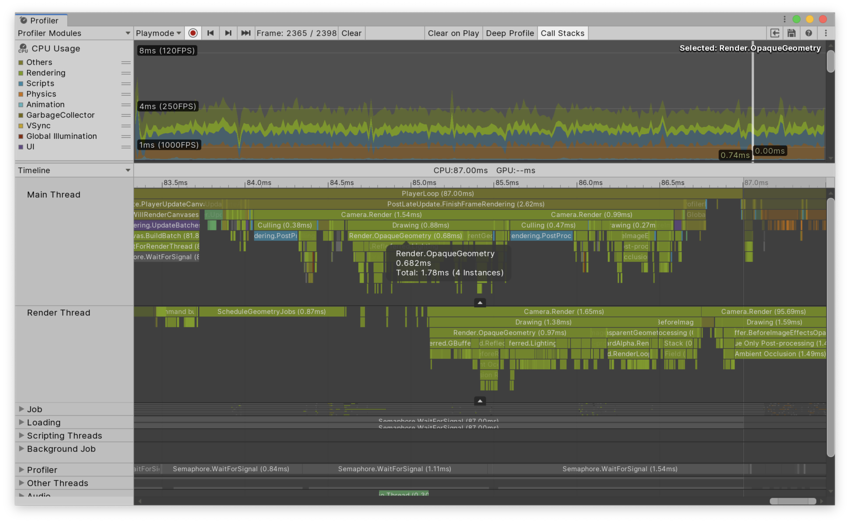
上图中,所选项上的工具提示可以提供更多详细信息,例如所有线程中的实例数和该样本的总时间。GC.Alloc 样本显示为红色/洋红色,并显示分配的大小。
要在工具提示中显示托管的调用栈,请导航到 Profiler 窗口的工具栏,然后选择 Call Stacks 按钮。必须先启用此属性,然后对帧进行性能分析以显示帧的调用栈。有关更多信息,请参阅关于分配调用栈的部分。
You can also manually measure any time span in the Timeline view; to do this, click and drag horizontally anywhere to display an overlay across a section of the timeline. The time ruler at the top displays the time encompassed by that overlay. Press the F key while the overlay is displayed to frame the view horizontally along the selected time section. Click anywhere to remove the overlay.
Hierarchy and Raw Hierarchy view
切换到 Hierarchy 或 Raw Hierarchy 视图时,只要样本在主线程上,您所做的选择就会继续存在。如果无法立即找到您的选择,请按 F 键进行聚焦。
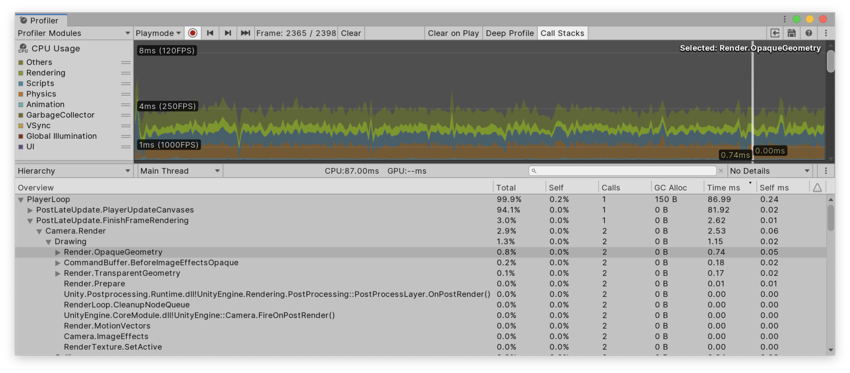
The Hierarchy view lists all samples you have profiled and groups them together by their shared call stack and the hierarchy of ProfilerMarkers. The Raw Hierarchy view does not group samples together, which makes it ideal for looking into samples on a granular level. You can also use the Thread dropdown to select a specific thread, like the Main Thread or Render Thread to inspect in these views. Both views display the following detailed information for each item in the Hierarchy, next to each row:
| 属性 | 功能 |
|---|---|
| Total | Unity 在特定函数上花费的总时间(以百分比表示)。 |
| Self | The total amount of time Unity spent on a particular function as a percentage, excluding the time Unity spends calling sub-functions. For example, in the screenshot, 41.7% of time is spent in the Camera.Render function. This is because it calls a lot of drawing and culling functions. However, when you exclude the functions it calls, only 3.5% of time is spent on the Camera.Render function itself. |
| Calls | 此帧中调用此函数的次数。在 Raw Hierarchy 视图中,此列中的值始终为 1,因为性能分析器不会合并样本的层级视图。 |
| GC Alloc | Unity 在当前帧中分配的脚本堆内存量。脚本堆内存由垃圾回收器管理。 每当 Unity 调用 GC.Collect() 或脚本堆分配大小超出堆的当前大小时,就会触发垃圾回收器。垃圾回收器会标记没有更多引用的所有分配并收集这些引用。此进程在性能分析器中显示为 GC.Collect 样本。在堆上分配得越多,Unity 运行垃圾回收器就越频繁。随着托管的堆不断增长,Unity 需要花费更长的时间来标记和收集内存。因此,应在应用程序运行时将 GC Alloc 值保持为零,从而防止垃圾回收器影响帧率,并使整体堆大小保持较小值。 有关托管堆的更多详细信息,请参阅关于了解自动内存管理的文档。 |
| Time ms | Unity 在特定函数上花费的总时间(以毫秒为单位)。如果应用程序使用作业系统或多线程渲染,则此信息可能会产生误导,因为它仅包含 Unity 在当前选定线程上花费的时间。要更改线程,请选择 Hierarchy 面板顶部的 Thread 下拉选单。 |
| Self ms | Unity 在特定函数上花费的总时间(以毫秒为单位),不包括 Unity 在调用子函数时花费的时间。 |
| Warning | 由警告图标指示,此处显示应用程序在当前帧中触发警告的次数。有关更多信息,请参阅本文档的性能警告部分。 |
要进一步了解应用程序在何处调用和使用了接受性能分析的函数,请选择模块详细信息面板右上角的 Details 下拉选单,然后选择 Show Related Objects 或 Show Calls 视图。
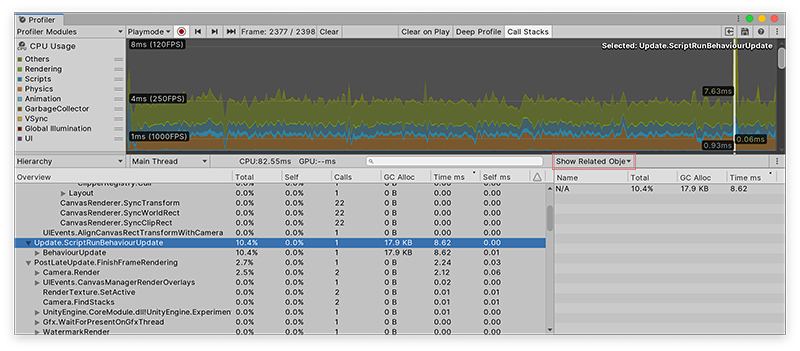
The Show Related Objects view displays a list of UnityEngine.Objects that are associated with the Profiler sample, using the Begin() overload that takes a UnityEngine.Object. Some samples Unity reports have these associations built in, such as Camera.Render samples that are linked to the Camera object that does the rendering. Unity reports these objects via their instance ID and resolves them to a name in the Profiler window.
When you click on one of these objects, Unity tries to find the object via the Scene hierarchy and ping it. Because the association uses the instance ID, pinging only works when you are profiling your application in the Editor, and for as long as the object still exists.
For GC.Alloc samples, this view displays a list of “N/A” items, one for each allocation that occured at this hierarchy level, with the size of the allocation listed in the GC.Alloc column. If you profile your application in the Editor with the Call Stacks setting enabled, when you select a GC.Alloc sample in this view, the call stack for the allocated scripting object you selected is displayed, even if you did not enable the Deep Profiling setting. For more information, see the Allocation call stacks section of this documentation.
Show Calls 视图显示从何处调用所选样本以及这个样本调用的其他函数。
Additionally, under the gear icon at the top of the module details pane, you can enable or disable the Collapse Editor Only Samples setting. This collapses all samples in the Player Loop that only happen because of Editor-only safety checks. When the samples are collapsed, their GC.Alloc value does not contribute to GC.Alloc value of their enclosing sample. This setting is enabled by default. For more information, see the Editor only samples section of this documentation.
Common samples
除了脚本代码生成的样本,Unity 还提供大量其他样本,可用于了解在应用程序中的哪些方面花费了时间。下表说明了一些较常见的样本的作用。
Main thread base samples
主线程基础样本可清晰区分在应用程序上花费的时间与在 Editor 和性能分析器活动中花费的时间。录制器也可以使用这些样本来获取主线程上帧的时间使用情况。
| 样本 | 功能 |
|---|---|
| PlayerLoop | The root to any samples that originate from your application’s main loop. When you enable the Profile Editor setting while the Player is running in the Editor in active playmode, this sample nests under the EditorLoop. |
| EditorLoop | The root to any samples that originate from the Editor’s main loop. This is only present while you profile a player in the Editor. When you disable the Profile Editor setting, this sample shows how much time of the frame was spent rendering and running the Editor that contains the Player. |
| Profiler.CollectEditorStats | 与收集不同活跃性能分析器模块的统计信息有关的任何样本的根。子样本 Profiler.CollectGlobalStats 下的任何样本都会在播放器上造成开销。所有其他子样本仅影响 Editor。要关闭特定模块,请关闭它们的图表或调用 Profiler.SetAreaEnabled()。 |
Script update samples
除非使用作业系统,否则大多数脚本代码都嵌套在以下样本下面:
| 样本 | 功能 |
|---|---|
| Update.ScriptRunBehaviourUpdate | 此样本包括对 MonoBehaviour.Update 的调用以及对协程的处理。 |
| BehaviourUpdate | 此样本处理所有 Update() 方法。 |
| CoroutinesDelayedCalls | 包含首次生成后的协程样本。 |
| PreLateUpdate.ScriptRunBehaviourLateUpdate | 此样本处理所有 LateUpdate() 方法。 |
| FixedBehaviourUpdate | 此样本处理所有 FixedUpdate() 方法。 |
Rendering and VSync samples
这些样本显示 CPU 在何处花时间来处理 GPU 的数据,或者可能在何处等待 GPU 完成。如果 GPU Profiler 不可用或者增加过多开销,则工具栏不会显示此信息。这些样本可用于了解应用程序是 CPU 密集型还是 GPU 密集型。
| 样本 | 功能 |
|---|---|
| WaitForTargetFPS | The time your application spends waiting for the targeted FPS that Application.targetFrameRate specifies. If this sample is a sub-sample of Gfx.WaitForPresent, it represents the amount of time your application spends waiting for the VSync configured in QualitySettings.vSyncCount. Note: The Editor doesn’t VSync on the GPU and instead uses WaitForTargetFPS to simulate the delay for VSync. Some platforms, in particular Android and iOS, enforce VSync or have a default frame rate cap of 30 or 60. |
| Gfx.ProcessCommands | Contains all processing of the rendering commands on the render thread. Some of that time might be spent waiting for VSync or new commands from the main thread, which you can see from it’s child sample Gfx.WaitForPresent. |
| Gfx.WaitForCommands | 指示渲染线程已准备好接受新命令,并且可能指示主线程上出现瓶颈。 |
| Gfx.PresentFrame | 指示应用程序在等待 GPU 渲染和呈现帧方面花费的时间,其中可能包括等待 VSync 的时间。 主线程上的 WaitForTargetFPS 样本可以显示该时间中等待 VSync 所花费的时间。 |
| Gfx.WaitForPresent | Indicates that the main thread is ready to start rendering the next frame, but the render thread has not finished waiting on the GPU to present the frame. This might indicate that your application is GPU-bound. To see what the render thread is simultaneously spending time on, check the Timeline view. If the render thread spends time in Camera.Render, your application is CPU-bound and might be spending too much time sending draw calls or textures to the GPU. If the render thread spends time in Gfx.PresentFrame, your game is GPU-bound or it might be waiting for VSync on the GPU. A WaitForTargetFPS sub-sample of GFX.WaitForPresent indicates the portion of the Present phase that your application spends waiting for VSync. The Present phase is the portion of time between Unity instructing the graphics API to swap the buffers, to the time that this operation is completed |
| Gfx.WaitForRenderThread | 指示主线程正在等待渲染线程处理目前位于命令流中的所有命令。此样本仅在多线程渲染中出现。 |
Multi threading samples
这些样本不会耗用 CPU 周期,而是突出显示与线程和 JobSystem 相关的信息。查看这些样本时,使用 Timeline 视图可以检查其他线程上同时发生的操作。
| 样本 | 功能 |
|---|---|
| Idle | Any time that the JobSystem does not untilize a Worker Thread, it emits an Idle sample. Small gaps between Idle samples usually happen when the JobSystem wakes them up, for example to schedule new Jobs. Longer gaps indicate a native Job that has not been instrumented. |
| Semaphore.WaitForSignal | 该线程正在等待另一线程中完成某项操作。要找出所等待的线程,请在 Timeline 视图中查看在此线程之前不久结束的所有样本。 |
| WaitForJobGroupID | 触发了 JobHandle 上的同步栅栏 (Sync Fence)。这可能导致工作窃取。一个工作线程完成工作,然后等待其他工作线程完成工作时,就会发生工作窃取。这些显示为在此样本下执行的作业样本。“被窃取”的作业不一定是所等待的作业。 |
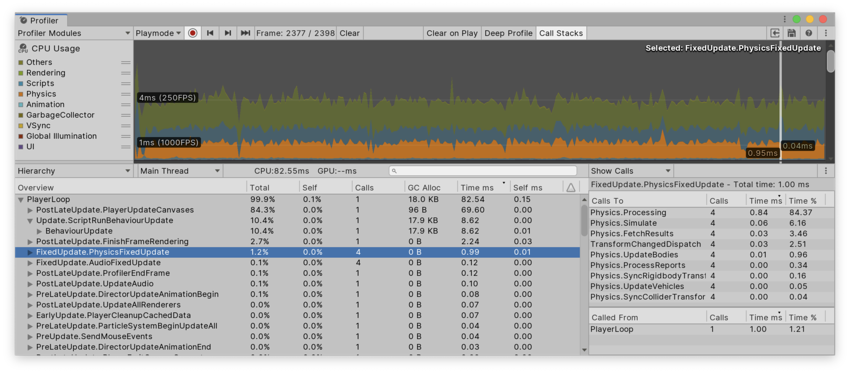
Physics samples
下表概括了一些高级物理性能分析器样本。FixedUpdate() 会调用所有这些样本。
| 样本 | 功能 | |
|---|---|---|
| Physics.Simulate | 通过指示物理引擎运行其模拟来更新物理系统的当前状态。 | |
| Physics.Processing | 处理所有非布料物理作业。展开此样本可显示物理引擎内部完成的工作的低级细节。 | |
| Physics.ProcessingCloth | 处理所有布料物理作业。展开此样本可显示物理引擎内部完成的工作的低级细节。 | |
| Physics.FetchResults | 从物理引擎收集物理模拟结果。 | |
| Physics.UpdateBodies | 更新所有物理体的位置和旋转。此样本还包含在发送这些更新时传达的消息。 | |
| Physics.ProcessReports | 在物理 FixedUpdate 结束后运行。处理模拟结果响应的各个阶段。在此样本中会更新接触、关节破坏和触发器并发送相关消息。包括四个不同的子阶段: |
|
| Physics.TriggerEnterExits | 处理 OnTriggerEnter 和 OnTriggerExit 事件。 |
|
| Physics.TriggerStays | 处理 OnTriggerStay 事件。 |
|
| Physics.Contacts | 处理 OnCollisionEnter、OnCollisionExit 和 OnCollisionStay 事件。 |
|
| Physics.JointBreaks | 处理与受损关节相关的更新和消息。 | |
| Physics.UpdateCloth | 包含与布料及其蒙皮网格相关的更新。 | |
| Physics.Interpolation | 管理所有物理对象的位置和旋转的插值。 | |
要了解有关脚本生命周期及脚本生命周期内的一般样本的更多信息,请参阅事件函数的执行顺序。
性能警告
CPU Profiler 能够检测到一些常见性能问题,并发出相关警告。这些警告会显示在模块详细信息面板 Hierarchy 视图中的 Warning 列内。
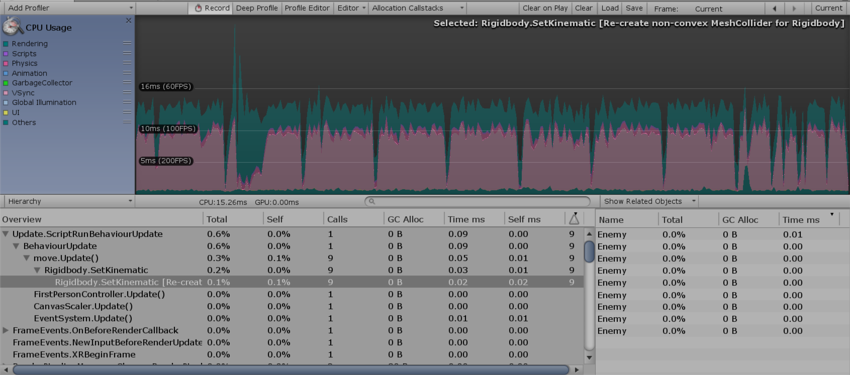
The Profiler can detect some specific calls that you should avoid in performance-critical contexts. It displays the warnings with the reasons the operations are expensive as follows:
- Rigidbody.SetKinematic:为刚体重新创建非凸面体 MeshCollider
- Animation.DestroyAnimationClip:触发 RebuildInternalState
- Animation.AddClip:触发 RebuildInternalState
- Animation.RemoveClip:触发 RebuildInternalState
- Animation.Clone:触发 RebuildInternalState
- Animation.Deactivate:触发 RebuildInternalState
Allocation call stacks
默认情况下已禁用 GC.Alloc 样本上已分配的调用栈,因为这些栈会因为多帧延迟而妨碍应用程序。但是,有时可能希望查看完整的调用栈以便了解 Unity 如何执行的代码。
为此,请导航到 Profiler 窗口的工具栏,然后选择 Call Stacks 按钮。无论是在 Editor 中还是在运行的播放器中进行性能分析,都可以使用此功能。启用此选项后,在进行性能分析的各个帧中,__GC.Alloc__ 样本包含它们的调用栈。
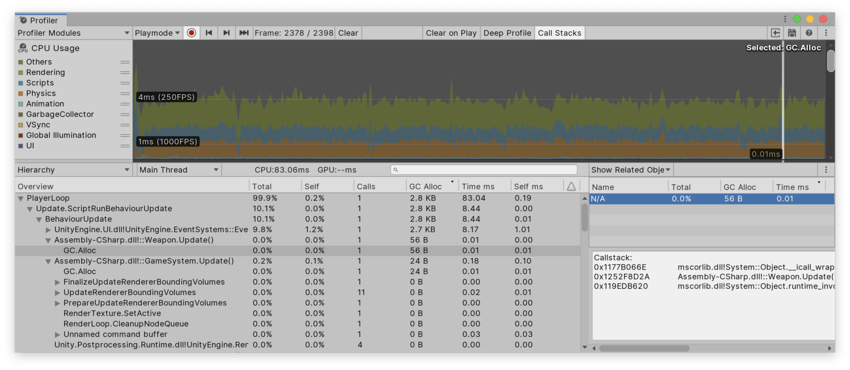
每个脚本堆分配在 Hierarchy 视图和 Timeline 视图中均显示为 GC.Alloc 样本。在 Timeline 视图中,颜色为亮红色。要查看某个调用栈,请选择 CPU Profiler 模块,然后在 Timeline 视图中选择一个 GC.Alloc 样本。选中的调用栈将突出显示。
或者,也可以在 Hierarchy 或 Raw Hierarchy 视图中查看此调用栈。将 Details 视图设置为 Show Related Objects。GC.Alloc 样本没有名称,因此在此面板中显示为 N/A。选择 N/A 对象后,性能分析器会在 Details 视图的下半部分中显示调用栈。
有关托管分配的更多信息,请参阅关于了解自动内存管理的文档。
Editor only samples
某些样本仅当您在 Editor 中进行性能分析时才出现。这包括如下的安全性检查:__GetComponentNullErrorWrapper__(有助于确定 null 组件使用情况)、CheckConsistency__(验证对象设置)、CheckAllowDestructionRecursive__(损坏检查)以及预制件相关活动。所有这些样本都不在播放器中。
默认情况下,在 Hierarchy 视图中,仅 Editor 样本都已折叠并被命名为 EditorOnly [SampleName]。尽管这些样本可能会导致垃圾收集分配,但是如果样本被折叠,则不会影响所属样本的 GC.Alloc 值。
要更改默认行为,请单击模块详细信息面板右上角的上下文菜单,然后禁用 Collapse EditorOnly Samples 设置。完成此操作后,可以展开此样本并将其 GC.Alloc 值贡献给所属样本。
此选项不会影响 Timeline 视图。通常可以忽略这些样本,或者将它们用作提示信息,从而对目标设备上的播放器构建进行性能分析以发现实际问题。
Copyright © 2023 Unity Technologies
优美缔软件(上海)有限公司 版权所有
"Unity"、Unity 徽标及其他 Unity 商标是 Unity Technologies 或其附属机构在美国及其他地区的商标或注册商标。其他名称或品牌是其各自所有者的商标。
公安部备案号:
31010902002961