CPU Usage Profiler module
CPU Usage プロファイラーモジュールには、アプリケーションのどこで時間が費やされているかを表示するチャートが含まれています。レンダリング、スクリプト、アニメーションなど、アプリケーションが時間を費やすすべての重要な領域の概要を提供します。このセクションには以下のトピックが含まれます。
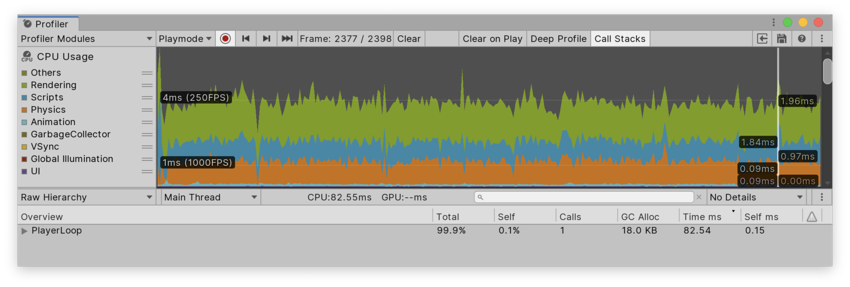
チャートのカテゴリ
CPU Usage プロファイラーモジュールのチャートは、アプリケーションのメインスレッドで費やされた時間を追跡します。タイミングは 9 のカテゴリに分けられます。チャートのカテゴリの順序を変更するには、カテゴリをチャートの凡例にドラッグアンドドロップします。カテゴリの色の付いた凡例をクリックして、表示を切り替えることもできます。
| カテゴリ | 説明 |
|---|---|
| Rendering | アプリケーションがグラフィックスのレンダリングに費やす時間。 |
| Scripts | アプリケーションがスクリプトの実行に費やす時間。 |
| Physics | アプリケーションが物理演算エンジンに費やす時間。 |
| Animation | アプリケーションがアプリケーション内のスキンしたメッシュレンダラー、ゲームオブジェクト、その他のコンポーネントをアニメーション化するのに費やす時間。これには、Animation コンポーネントと Animator コンポーネントが使用するシステムが計算に要した時間も含まれます。 |
| GarbageCollector | アプリケーションが ガベージコレクター の実行に費やす時間。 |
| VSync | アプリケーションが targetFrameRate または次の VBlank との同期を待機するフレームごとの時間。これは、 QualitySettings.vSyncCount 値、ターゲットフレームレート、または VSync 設定 (アプリケーションが実行されているプラットフォームのデフォルト、または最大値) に基づいています。VSync の詳細については、このページの レンダリングと VSync のサンプル を参照してください。 |
| Global Illumination | アプリケーションがライティングに費やす時間。 |
| UI | How much time your application spends on displaying your its UI. |
| Others | How much time your application spends on code that does not fall into any of the other categories. This includes areas like the entire EditorLoop, or the Profiling overhead when profiling Play Mode in the Editor. |
モジュールの詳細ペイン
When you select the CPU Usage module, the details pane below it displays a breakdown of where the application spent time in the selected frame. You can display the timing data as either a timeline or a hierarchical table; to change the display, use the top-left dropdown in the details pane (set to Timeline by default). The three views available are:
| 表示 | 機能 |
|---|---|
| Timeline | Displays a breakdown of the timings for a particular frame, alongside a time axis of the frame’s length. This is the only view mode that you can use to see timings on threads other than the main thread, and correlate timings across threads (for example, Job System worker threads starting up after a system on the main thread schedules them). |
| Hierarchy | GGroups the timing data by its internal hierarchical structure. This option displays the elements that your application called in a descending list format, ordered by the time spent by default. You can also order the information by the amount of scripting memory allocated (GC Alloc), or the number of calls. To change the column that orders the table, click the table column’s header. |
| Raw Hierarchy | 時間のデータを、タイミングが発生したコールスタックと同様の階層構造で表示します。Hierarchy ビューのように各コールスタックをマージせずに、このモードでは個別にリストします。 |
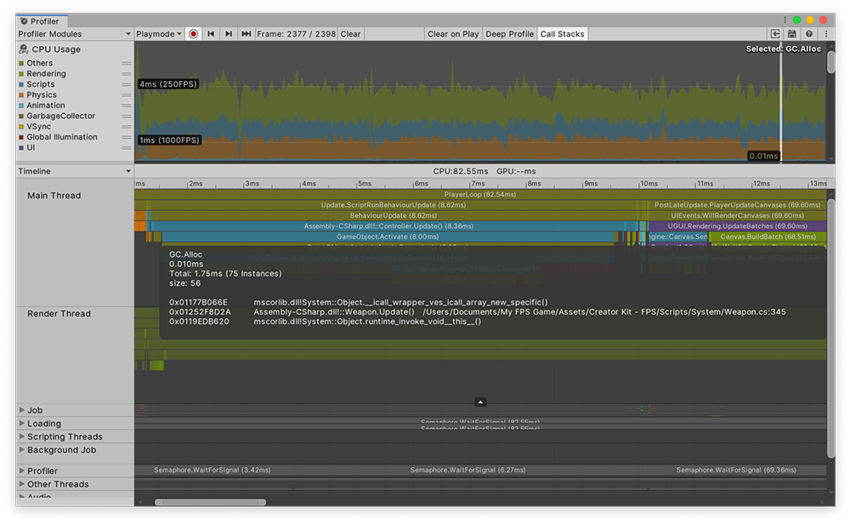
Timeline view
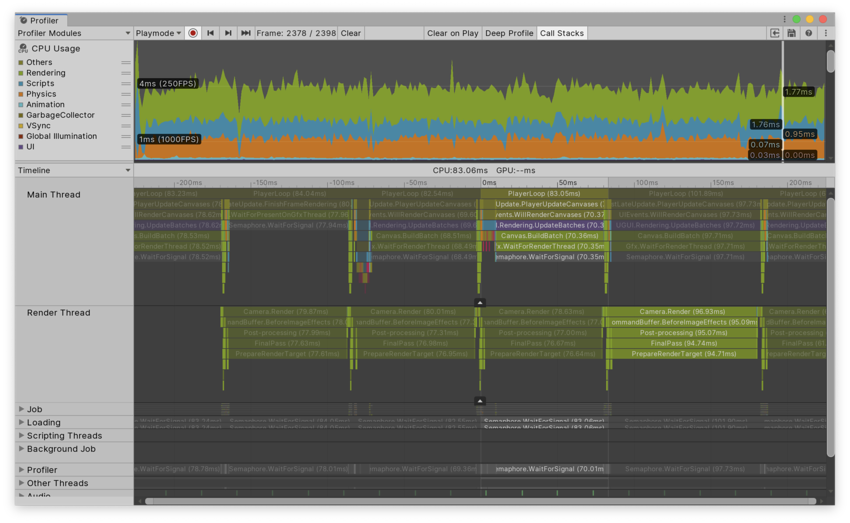
The Timeline view is the default view for the CPU Usage Profiler module. It contains an overview of where time is spent in your application and how the timings relate to each other. The Timeline view displays profiling data from all threads in their own own subsections and along the same time axis. This is unlike the Hierarchy views, which only show profiling data from the main thread.
タイムラインビューを使用して、並列実行で異なるスレッドのアクティビティが互いにどのように相関しているかを確認できます。 Job Systemのワーカースレッドなど、さまざまなスレッドをどれだけ使用しているか、どれだけ使用しているか、スレッドでの作業がどのようにキューに入れられているか、アイドル状態( Idle サンプル)か、別のスレッドや待機中の スレッドがあるかを確認できます。ジョブの終了( Wait for x サンプル)
Navigating and selecting items
To zoom in on areas of the time axis, use the scroll wheel on your mouse, or press and hold the Alt key while you drag with the right mouse button pressed down. You can also use the ends of the horizontal scrollbar to zoom in. Press the A key on your keyboard to reset the zoom so that the entire frame time is visible.
Whenever you see a white arrow on the bottom of a thread, you can click it to unfold the thread to show all lines, or click again to show only the top ones. You can also drag the line that separates the threads to readjust how many lines you can see. Double-clicking the line sets the height of the thread’s section to the maximum depth of the call stack. To pan the view, press the middle mouse button, or hold the Alt key (Command key on macOS) and press the left mouse button.
スレッドのグループを折りたたんだり展開したりするには、ビューの左端にあるスレッド名の横の折りたたみ矢印をクリックします。
To see an item’s contribution to the CPU chart, select it in the lower pane. The Profiler highlights its contribution, and dims the rest of the chart. To deselect the item, click elsewhere in the view. Press the F key to focus the current sample you selected, or to show the default zoom level if you’ve selected nothing.
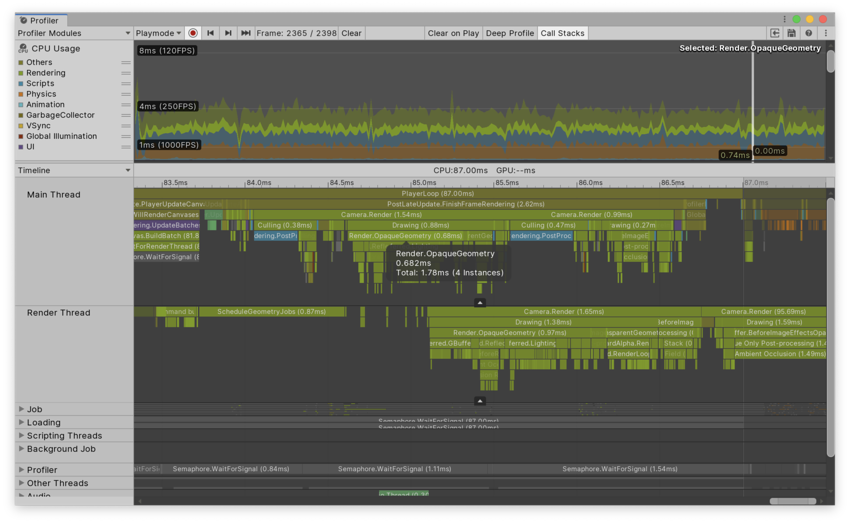
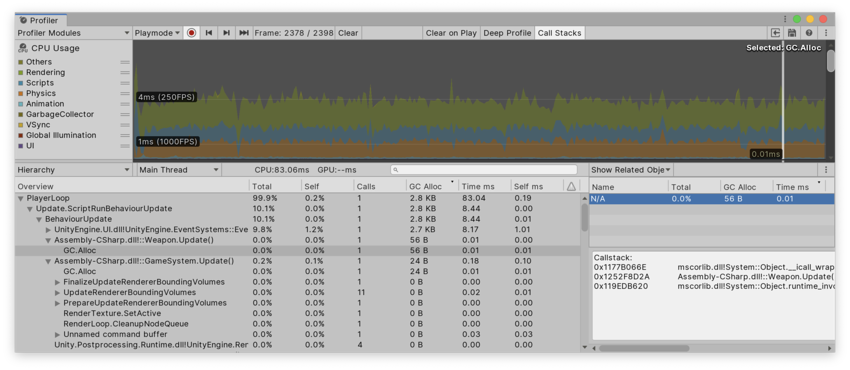
上の画像では、選択したアイテムのツールチップに、インスタンス数やすべてのスレッドにわたるこのサンプルの合計時間などの詳細が表示されます。GC.Alloc サンプルは赤紫色でアロケーションのサイズを示します。
マネージコールスタックをツールチップに表示するには、Profiler ウィンドウのツールバーに移動し、Call Stacks ボタンを選択します。フレームのコールスタックを表示するには、フレームをプロファイルする前にこのプロパティーを有効にする必要があります。詳細については、アロケーションコールスタック を参照してください。
You can also manually measure any time span in the Timeline view; to do this, click and drag horizontally anywhere to display an overlay across a section of the timeline. The time ruler at the top displays the time encompassed by that overlay. Press the F key while the overlay is displayed to frame the view horizontally along the selected time section. Click anywhere to remove the overlay.
Hierarchy and Raw Hierarchy view
Hierarchy または Raw Hierarchy ビューに切り替えると、サンプルがメインスレッド上にある限り、選択が引き継がれます。選択したものがすぐに見つからない場合は、F キーを押してフォーカスします。
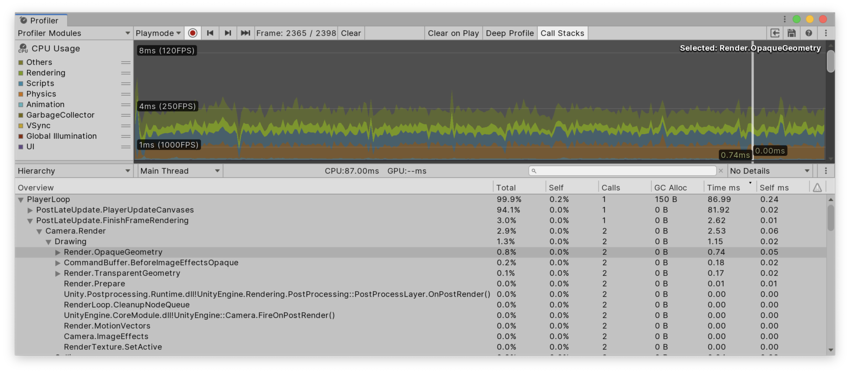
The Hierarchy view lists all samples you have profiled and groups them together by their shared call stack and the hierarchy of ProfilerMarkers. The Raw Hierarchy view does not group samples together, which makes it ideal for looking into samples on a granular level. You can also use the Thread dropdown to select a specific thread, like the Main Thread or Render Thread to inspect in these views. Both views display the following detailed information for each item in the Hierarchy, next to each row:
| プロパティー | 機能 |
|---|---|
| Total | Unity が特定の関数に費やした合計時間 (パーセンテージ) |
| Self | The total amount of time Unity spent on a particular function as a percentage, excluding the time Unity spends calling sub-functions. For example, in the screenshot, 41.7% of time is spent in the Camera.Render function. This is because it calls a lot of drawing and culling functions. However, when you exclude the functions it calls, only 3.5% of time is spent on the Camera.Render function itself. |
| Calls | このフレームでこの関数に対して行われた呼び出しの数。Raw Hierarchy ビューでは、プロファイラーはサンプルの階層をマージしないため、この列の値は常に 1 です。 |
| GC Alloc | Unity が現在のフレームに割り当てたスクリプティングのヒープメモリの量。スクリプティングのヒープメモリは、ガベージコレクタ によって管理されます。 Unity が GC.Collect() を呼び出すか、ヒープの現在のサイズに収まらないスクリプティングヒープの割り当てがある場合は常に、ガベージコレクターがトリガーされます。参照がなくなったすべての割り当てにマークを付けて収集します。このプロセスは、プロファイラーで GC.Collect サンプルとして表示されます。Unity は、ヒープにより多くを割り当てると、ガベージコレクターをより頻繁に実行します。 マネージヒープが増加すると、Unity がメモリにマークして回収するのに時間がかかります。そのため、アプリケーションの実行中は GC Alloc 値をゼロに保ち、ガベージコレクターがフレームレートに影響を与えないようにし、全体的なヒープサイズを小さく保つ必要があります。 管理ヒープの詳細については、自動メモリ管理 のドキュメントを参照してください。 |
| Time ms | Unity が特定の関数に費やした合計時間 (ミリ秒)。アプリケーションが Job System やマルチスレッドレンダリングを使用する場合、現在選択しているスレッドで費やした時間しか含まれていないため、この情報は誤解を招く可能性があります。スレッドを変更するには、Hierarchy ペインの上部にある Thread ドロップダウンを選択します。 |
| Self ms | Unity が特定の関数に費やした合計時間 (ミリ秒)。Unity がサブ関数を呼び出す時間は除きます。 |
| Warning | 警告アイコンで示され、現在のフレーム中にアプリケーションが警告をトリガーした回数を表示します。詳細については、パフォーマンスの警告 を参照してください。 |
アプリケーションがプロファイルされた関数をどこで呼び出し、使用するかに関する詳細情報を取得するには、モジュールの詳細ペインの右上にある Details ドロップダウンを選択し、Show Related Objects か Show Calls ビューのいずれかを選択します。
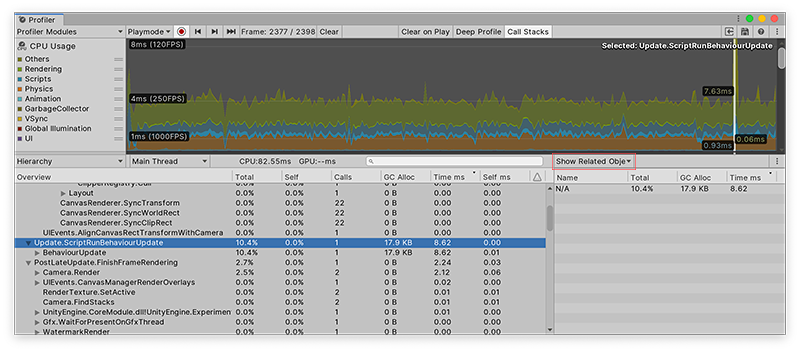
The Show Related Objects view displays a list of UnityEngine.Objects that are associated with the Profiler sample, using the Begin() overload that takes a UnityEngine.Object. Some samples Unity reports have these associations built in, such as Camera.Render samples that are linked to the Camera object that does the rendering. Unity reports these objects via their instance ID and resolves them to a name in the Profiler window.
When you click on one of these objects, Unity tries to find the object via the Scene hierarchy and ping it. Because the association uses the instance ID, pinging only works when you are profiling your application in the Editor, and for as long as the object still exists.
For GC.Alloc samples, this view displays a list of “N/A” items, one for each allocation that occured at this hierarchy level, with the size of the allocation listed in the GC.Alloc column. If you profile your application in the Editor with the Call Stacks setting enabled, when you select a GC.Alloc sample in this view, the call stack for the allocated scripting object you selected is displayed, even if you did not enable the Deep Profiling setting. For more information, see the Allocation call stacks section of this documentation.
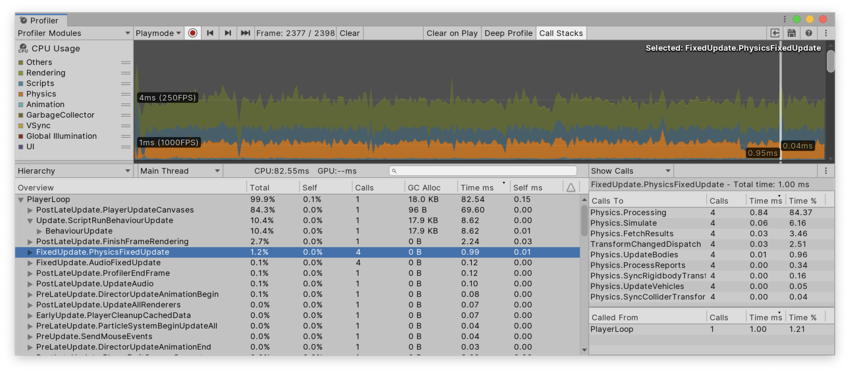
Show Calls ビューは、選択されたサンプルがどこから呼び出されているか、他のどの関数を呼び出すかを表示します。
Additionally, under the gear icon at the top of the module details pane, you can enable or disable the Collapse Editor Only Samples setting. This collapses all samples in the Player Loop that only happen because of Editor-only safety checks. When the samples are collapsed, their GC.Alloc value does not contribute to GC.Alloc value of their enclosing sample. This setting is enabled by default. For more information, see the Editor only samples section of this documentation.
Common samples
スクリプティングコードが生成するサンプルと同様に、Unity は、アプリケーションで何に時間がかかっているかを理解するための多くのサンプルを提供します。以下の表は、一般的なサンプルの一部を説明しています。
Main thread base samples
メインスレッドの基本サンプルは、アプリケーションに費やされた時間と、エディターとプロファイラーの働きに費やされた時間を明確に区別します。Recorder は、これらのサンプルを使用してメインスレッドのフレームのタイミングを取得することもできます。
| サンプル | 機能 |
|---|---|
| PlayerLoop | The root to any samples that originate from your application’s main loop. When you enable the Profile Editor setting while the Player is running in the Editor in active playmode, this sample nests under the EditorLoop. |
| EditorLoop | The root to any samples that originate from the Editor’s main loop. This is only present while you profile a player in the Editor. When you disable the Profile Editor setting, this sample shows how much time of the frame was spent rendering and running the Editor that contains the Player. |
| Profiler.CollectEditorStats | さまざまな種類のアクティブなプロファイラーモジュールの統計の収集に関連するサンプルのルート。 子サンプル Profiler.CollectGlobalStats 下の任意のサンプルは、プレイヤーのオーバーヘッドの起因になります。他のすべての子サンプルはエディターにのみ影響します。特定のモジュールをオフにするには、それらのチャートを閉じるか、Profiler.SetAreaEnabled() を 呼び出します。 |
Script update samples
ジョブシステムを使用していない限り、ほとんどのスクリプトコードは以下のサンプルの下にネストされます。
| サンプル | 機能 |
|---|---|
| Update.ScriptRunBehaviourUpdate | このサンプルには、MonoBehaviour.Update への呼び出しとコルーチンの処理が含まれています。 |
| BehaviourUpdate | このサンプルは、すべての Update() メソッドを処理します。 |
| CoroutinesDelayedCalls | 最初の yield の後にコルーチンサンプルが含まれます。 |
| PreLateUpdate.ScriptRunBehaviourLateUpdate | このサンプルは、すべての LateUpdate() メソッドを処理します。 |
| FixedBehaviourUpdate | このサンプルは、すべての FixedUpdate() メソッドを処理します。 |
Rendering and VSync samples
これらのサンプルは、CPU が GPU のデータ処理の何に時間を費やしているのか、または、どこで GPU の終了を待機しているのかを表示します。GPU プロファイラーが使用できない場合や、オーバーヘッドが多すぎる場合は、ツールバーにこの情報は表示されません。これらのサンプルは、アプリケーションが CPU バウンドか GPU バウンドかを判断するのに役立ちます。
| サンプル | 機能 |
|---|---|
| WaitForTargetFPS | The time your application spends waiting for the targeted FPS that Application.targetFrameRate specifies. If this sample is a sub-sample of Gfx.WaitForPresent, it represents the amount of time your application spends waiting for the VSync configured in QualitySettings.vSyncCount. Note: The Editor doesn’t VSync on the GPU and instead uses WaitForTargetFPS to simulate the delay for VSync. Some platforms, in particular Android and iOS, enforce VSync or have a default frame rate cap of 30 or 60. |
| Gfx.ProcessCommands | Contains all processing of the rendering commands on the render thread. Some of that time might be spent waiting for VSync or new commands from the main thread, which you can see from it’s child sample Gfx.WaitForPresent. |
| Gfx.WaitForCommands | レンダースレッドが新しいコマンドの準備ができていることを示し、メインスレッドのボトルネックを示す場合もあります。 |
| Gfx.PresentFrame | GPU がフレームをレンダリングして表示するのをアプリケーションが待機する時間を示します。これには VSync を待機する時間も含まれる場合があります。 メインスレッドの WaitForTargetFPS サンプルは、VSync の待機に費やされる時間を示します。 |
| Gfx.WaitForPresent | Indicates that the main thread is ready to start rendering the next frame, but the render thread has not finished waiting on the GPU to present the frame. This might indicate that your application is GPU-bound. To see what the render thread is simultaneously spending time on, check the Timeline view. If the render thread spends time in Camera.Render, your application is CPU-bound and might be spending too much time sending draw calls or textures to the GPU. If the render thread spends time in Gfx.PresentFrame, your game is GPU-bound or it might be waiting for VSync on the GPU. A WaitForTargetFPS sub-sample of GFX.WaitForPresent indicates the portion of the Present phase that your application spends waiting for VSync. The Present phase is the portion of time between Unity instructing the graphics API to swap the buffers, to the time that this operation is completed |
| Gfx.WaitForRenderThread | レンダースレッドが現在コマンドストリームにあるすべてのコマンドを処理するのをメインスレッドが待機していることを示します。このサンプルは、マルチスレッドレンダリングでのみ発生します。 |
Multi threading samples
これらのサンプルは CPU サイクルを消費しませんが、代わりにスレッドとジョブシステムに関連する情報を強調します。これらのサンプルが表示されたら、Timeline ビュー を使用して、同時に他のスレッドで何が起こっているかを確認します。
| サンプル | 機能 |
|---|---|
| Idle | Any time that the JobSystem does not untilize a Worker Thread, it emits an Idle sample. Small gaps between Idle samples usually happen when the JobSystem wakes them up, for example to schedule new Jobs. Longer gaps indicate a native Job that has not been instrumented. |
| Semaphore.WaitForSignal | このスレッドは別のスレッドで何かが終了するのを待機しています。待機しているスレッドを見つけるには、Timeline ビューでこのサンプルの直前に終了したサンプルを確認します。 |
| WaitForJobGroupID | JobHandle の同期フェンスがトリガーされました。これは、ワークスチール を引き起こす可能性があります。これは、ワーカーが作業を終了し、他のワーカージョブが完了するのを確認するときに発生します。これらは、このサンプルの下で実行されるジョブサンプルとして表示されます。“盗まれた” ジョブは、必ずしも待機されていたジョブではありません。 |
Physics samples
次の表は、高レベルの物理演算プロファイラーサンプルの一部をまとめたものです。FixedUpdate() はこれらすべてのサンプルを呼び出します。
| サンプル | 機能 | |
|---|---|---|
| Physics.Simulate | シミュレーションを実行するよう物理演算エンジンに指示して、現在の物理演算状態を更新します。 | |
| Physics.Processing | クロス以外のすべての物理関連ジョブを処理します。このサンプルを展開すると、 物理演算エンジンで内部的に行われた作業の低レベルの詳細が表示されます。 | |
| Physics.ProcessingCloth | すべてのクロスの物理演算ジョブを処理します。このサンプルを展開すると、 物理演算エンジンで内部的に行われた作業の低レベルの詳細が表示されます。 | |
| Physics.FetchResults | 物理演算エンジンによる物理演算シミュレーションの結果を収集します。 | |
| Physics.UpdateBodies | すべての物理関連ボディの位置と回転を更新します。このサンプルには、これらの更新が送信されるときに通知するメッセージも含まれています。 | |
| Physics.ProcessReports | 物理演算の FixedUpdate が終了すると実行されます。シミュレーションの結果に応答するさまざまな段階を処理します。このサンプルには、接触、ジョイントのブレーク、更新とメッセージのトリガーが含まれます。4 つの異なるサブステージがあります。 |
|
| Physics.TriggerEnterExits |
OnTriggerEnter と OnTriggerExit イベントを処理します。 |
|
| Physics.TriggerStays |
OnTriggerStay イベントを処理します。 |
|
| Physics.Contacts |
OnCollisionEnter、OnCollisionExit、OnCollisionStay イベントを処理します。 |
|
| Physics.JointBreaks | 壊れたジョイントに関連する更新とメッセージを処理します。 | |
| Physics.UpdateCloth | クロスとそのスキンメッシュに関する更新が含まれます。 | |
| Physics.Interpolation | すべての物理演算オブジェクトの位置と回転の補間を管理します。 | |
スクリプトのライフサイクル内のスクリプトのライフサイクルと一般的なサンプルの詳細については、イベント関数の実行順序 を参照してください。
パフォーマンスに関する警告
CPU プロファイラーは一般的なパフォーマンスの問題を検出し、警告します。これらは、モジュールの詳細ペインの Hierarchy ビューの Warning 列に表示されます。
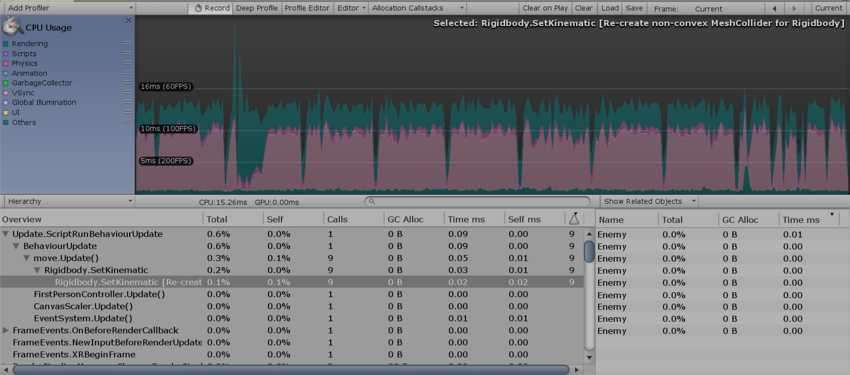
The Profiler can detect some specific calls that you should avoid in performance-critical contexts. It displays the warnings with the reasons the operations are expensive as follows:
- Rigidbody.SetKinematic は凸状でないメッシュコライダーを再作成します
- Animation.DestroyAnimationClip は RebuildInternalState をトリガーします
- Animation.AddClip は RebuildInternalState をトリガーします
- Animation.RemoveClip は RebuildInternalState をトリガーします
- Animation.Clone は RebuildInternalState をトリガーします
- Animation.Deactivate は RebuildInternalState をトリガーします
Allocation call stacks
デフォルトでは、GC.Alloc サンプルに割り当てられたコールスタックは無効になっています。これは、コールスタックが複数フレームの遅延でアプリケーションを混乱させる可能性があるためです。ただし、Unity がコードを実行する様子を確認するために、すべてのコールスタックを確認したい場合があります。
これを行うには、Profiler ウィンドウのツールバーに移動し、 Call Stacks ボタンを選択します。この機能は、エディターでプロファイルする場合でも、実行中のプレイヤーでプロファイルする場合でも使用できます。このオプションをオンにすると、プロファイルするフレームでは、GC.Alloc サンプルにコールスタックが含まれます。
すべてのスクリプティングヒープの割り当ては、Hierarchy ビューと Timeline ビューの両方で GC.Alloc サンプルとして表示されます。Timeline ビューでは、明るい赤紫色になります。コールスタックを表示するには、CPU プロファイラーモジュールを選択し、Timeline ビューで GC.Alloc サンプルを選択します。コールスタックは、選択範囲がハイライトされて表示されます。
代わりに、Hierarchy または Raw Hierarchy ビューでコールスタックを見ることができます。Details ビューを Show Related Objects に設定します。GC.Alloc サンプルには名前がないため、このパネルでは N/A と表示されます。N/A オブジェクトを選択すると、プロファイラーは詳細ビューの下半分にコールスタックを表示します。
マネージアロケーションの詳細については、自動メモリ管理を理解します を参照してください。
Editor only samples
一部のサンプルは、エディターでプロファイルするときにのみ表示されます。これには、GetComponentNullErrorWrapper などのセキュリティチェックが含まれます。これは、null コンポーネントの使用を識別するのに役立ちます。CheckConsistency はオブジェクトの設定を検証します。CheckAllowDestructionRecursive は破棄のチェックです。プレハブ関連の作業も含まれます。これらのサンプルのすべてがプレイヤーにあるわけではありません。
デフォルトでは、エディターのみのサンプルは Hierarchy ビューで折りたたまれ、EditorOnly [サンプル名] と名付けられます。ガベージコレクションの割り当てを引き起こす可能性がありますが、それらが折りたたまれている場合、それらを含むサンプルの GC.Alloc 値には影響しません。
デフォルトの動作を変更するには、モジュールの詳細ペインの右上にあるコンテキストメニューをクリックし、Collapse EditorOnly Samples 設定を無効にします。これを行うと、サンプルを展開し、その GC.Alloc 値を一緒に梱包するサンプルに加えることができます。
このオプションは Timeline ビューには影響しません。通常は、これらのサンプルを無視するか、それらをプロンプトとして使用してターゲットデバイスでプレイヤービルドをプロファイルして、実際の問題を見つけます。
Copyright © 2023 Unity Technologies
优美缔软件(上海)有限公司 版权所有
"Unity"、Unity 徽标及其他 Unity 商标是 Unity Technologies 或其附属机构在美国及其他地区的商标或注册商标。其他名称或品牌是其各自所有者的商标。
公安部备案号:
31010902002961