Memory
The Memory window tracks the memory allocated for your application. It can automatically capture memory snapshots for the selected application periodically. You can select Memory tag to open the Memory window.
Note: This will affect the application’s performance, you can disable automatic capture and instead press a button to capture a memory snapshot manually.
For more information, you can click the following link to reach directly:
Memory window interface
To open the Memory window:
- Open the OpenHarmony Hilog window.
- From the tag, select Memory.

| Area | Description |
|---|---|
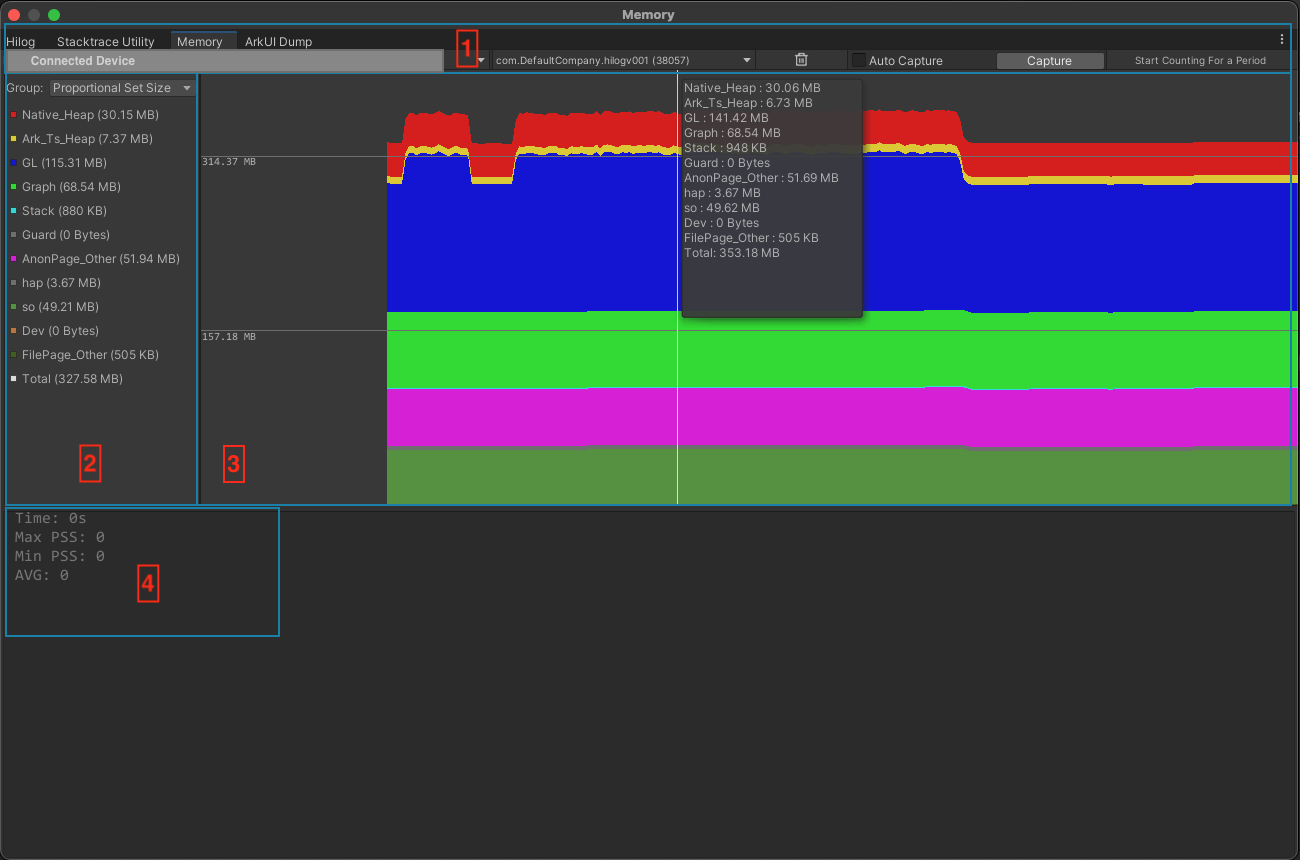
| 1 | Memory toolbar: Contains tools and features to capture memory. |
| 2 | Memory details panel: Displays the amount of allocated memory for each memory type. |
| 3 | Memory chart: Contains a chart of the memory allocated for the connected application over time. |
| 4 | Memory statistics: Displays summary of memory during period time. |
Memory toolbar
Before capturing, please make sure your OpenHarmony device have already connected to Tuanjie Editor correctly and select the process.
If you select Auto Capture, Tuanjie periodically captures memory snapshots for the selected application. If you unselect Auto Capture, the memory window provides a Capture button which you can use to manually capture a memory snapshot. This is useful if the automatic memory requests affect the application’s performance.
If you want to clear all displayed chart and start new period, select Clear icon.
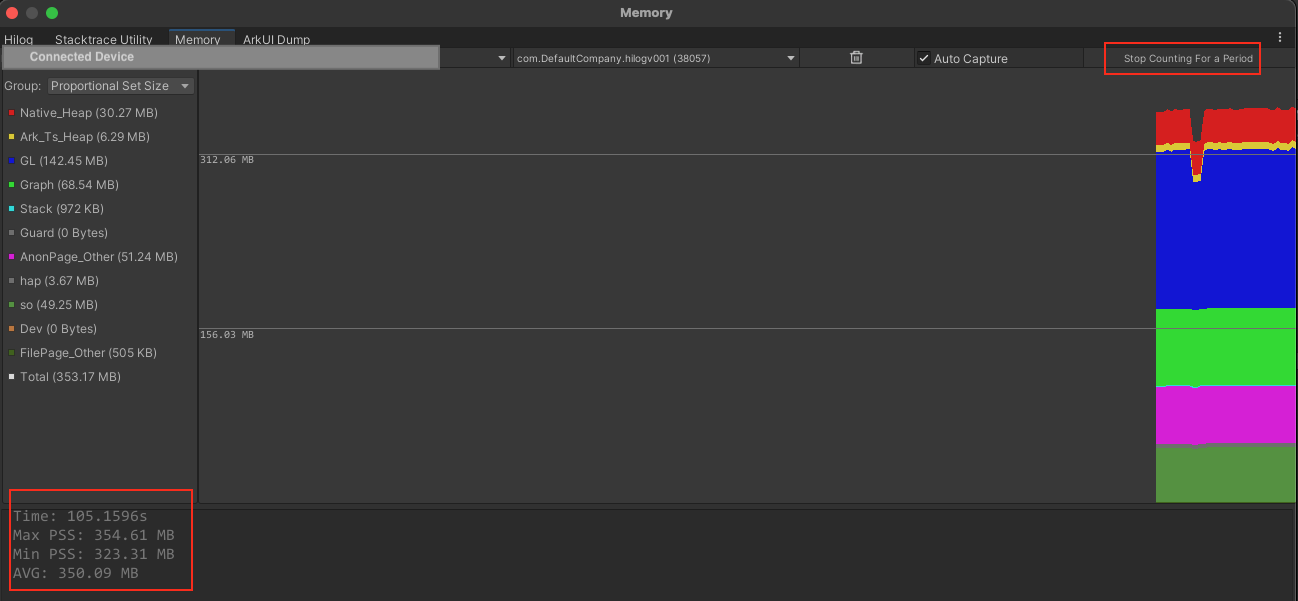
Select Start Counting For a Period to obtain the summary results for a period of time. For more information, you can check Capture memory for a period.
Memory details panel
The memory details panel displays the amount of memory for each memory type. It can display different memory groups.
| Group | Description |
|---|---|
| Resident Set Size (RSS) | The total amount of memory in RAM that the application allocated. This includes both shared and non-shared memory pages. For example, applications that access the same library share memory pages. |
| Proportional Set Size (PSS) | The total amount of memory in RAM that the application actively uses. This is not the total memory that the application allocates. For example, if the application allocates memory from the native heap but doesn’t read from or write to the memory, the memory doesn’t appear in PSS memory. Note: If several processes share a memory page, the size contribution of the page to PSS memory is proportional to the amount of memory and number of processes that share it. For example, if two processes share 20MB of graphics memory, the application’s PSS memory only shows 10MB. |
| Heap Alloc | The total amount of memory the application allocates using Dalvik (Java allocators) and native heap allocators. This includes both memory which is in RAM or is paged in storage. This is the best metric when checking if the application is leaking Native or Java memory. |
| Heap Size | The total memory that the application reserves. This memory size will be always bigger than Heap Alloc. |
Memory chart
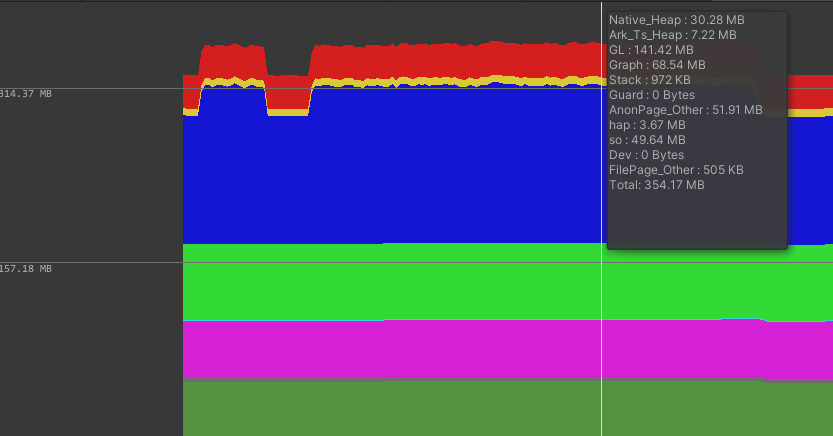
The memory chart displays the memory allocated for the connected application over time. You can hover your mouse to see the memory usage at a certain moment.

Memory statistics
The Memory statistics shows the summary results for a period of time. For more information, you can check Capture memory for a period.
How to capture memory
Capture memory automatically or manually
To use the Memory tool to capture memory for your application automatically or manually:
- Open the Memory window.
- Make sure your OpenHarmony device is connected to the OpenHarmony Hilog.
- Select device.
- Open the application on your device and select application by package name on memory windows.
- Select Auto Capture, the memory information will be displayed on the window automatically.
- Unselect Auto Capture, the memory information will be displayed on the window when clicking Capture manually.
Capture memory for a period
To use the Memory tool to collect memory usage over time:
- Open the Memory window.
- Make sure your OpenHarmony device is connected to the OpenHarmony Hilog.
- Select device.
- Open the application on your device and select application by package name on memory windows.
- Select Start Counting For a Period, start timing and counting memory data.
- Select Stop Counting For a Period, the average memory usage during this period as well as the maximum and minimum values are shown below.
