Stacktrace Utility
The Stacktrace Utility tool resolves custom stacktraces to help you debug crashes. You can select Stacktrace Utility tag to open the Stacktrace Utility window.
For more information, you can click the following link to reach directly:
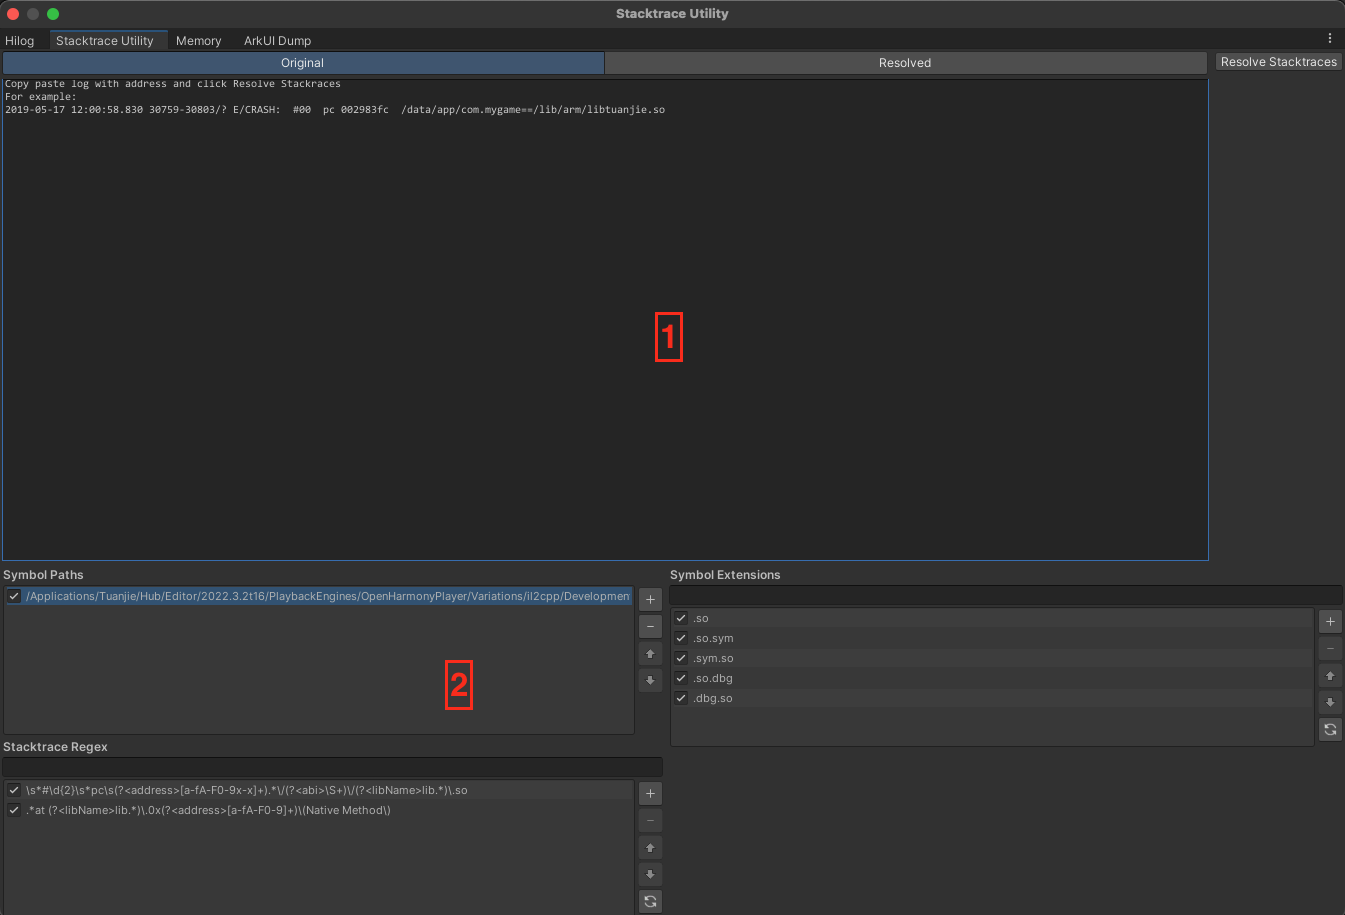
Stacktrace Utility window interface
To open the Stacktrace Utility window:
- Open the OpenHarmony Hilog window.
- From the tag, select Stacktrace Utility.

| Area | Description |
|---|---|
| 1 | Stacktrace display: Contains a text area to enter a custom stacktrace, and a text area to display the resolved stacktrace. |
| 2 | Path settings: Contains settings includes symbol paths, stacktrace regex, symbol extensions. |
Stacktrace display
The stacktrace display contains two tabs and a button:
- Original: A text area that you can copy stacktraces into for the Stacktrace Utility tool to resolve.
- Resolved: A text area that the Stacktrace Utility tool populates with the resolved stacktrace you entered into the Original tab.
- Resolve Stacktraces: Resolves the stacktrace currently in the Original text area of the stacktrace display then displays the resolved stacktrace in the Resolved text area.
Path settings
Before you use the Stacktrace Utility tool, you must provide it with the resources it requires to resolve stacktraces.
Configure symbol paths
To resolve stacktrace for an application, the Stacktrace Utility tool requires paths to the libmain, libtuanjie, and libil2cpp symbol files. To configure these paths:

- Use the default symbol files:
- In the Symbol Paths, select Add > Tuanjie Version.
- Select il2cpp and Development or Release.
- Use the custom symbol files:
- In the Symbol Paths, select Add > Pick Custom Location.
- Find the
libmain,libunity, andlibil2cppsymbol files and add the folder that each of them are within.
Note: When the Stacktrace Utility tool resolves stacktraces, it iterates through the symbol path list and uses the first located version of each symbol file. If you use more than one symbol path, be aware of symbol files with the same file name in multiple folders, because the tool only uses the first one it finds.
Configure stacktrace regex
The Stacktrace Utility tool uses regular expressions to parse entries. By default, the tool contains regular expressions that parse the address and library name from each entry, but you can add your own regular expressions to resolve addresses and library names.

To add your own regular expressions, you can enter your regular expression and click Add in the text input field.
Note: From the regular expressions list, the one at the top is used for resolving the function address and library name. If it fails, the next one in the order is used as a fallback. You can modify the order as per your preference.
Configure symbol extensions
Use the Symbol Extensions setting to specify file extensions which are appended to symbol file names during stacktrace resolving.

To add your own regular expressions, you can enter your symbol extensions and click Add in the text input field.
How to resolve a stacktrace
To use the Stacktrace Utility tool to resolve a stacktrace for your application:
- Open the Stacktrace Utility window.
- Make sure Symbol Paths, Symbol Extensions and Stacktrace Regex are set up correctly.
- In the Stacktrace display section, open the Original tab.
- Paste your stacktrace into the text area in the Original tab.
- Select Resolve Stacktraces.
- Open the Resolved tab and view the resolved stacktrace.