Audio Profiler
In the Profiler window there is a pane called Audio. The pane monitors significant performance meters about the audio system, such as total load and voice counts. When you highlight the pane, the lower part of the window changes into a detailed view about various parts of the audio system not covered by the graphs.
- Playing Sources is the total playing sources in the scene at a specific frame. Monitor this to see if audio is overloaded.
- Paused Sources is the total paused sources in the scene at a specific frame.
- Audio Voice is the actually number of audio (FMOD channels) voices used. PlayOneShot is using voices not shown in Playing Sources.
- Audio Memory is the total RAM used by the audio engine.
CPU usage can be seen in the bottom. Monitor this to see if Audio alone is taking up too much CPU.
Click the Channels, Groups or Channels and groups buttons for detailed per-frame logging of sound events. Here these events can be obtained and scrubbed, just like the renderer and memory graphs.
The rows in the frame log reveal information such as which audio sources played which clips, the volume at which they were played, the distance to the listener, and relative playback time. Clicking on one of these rows highlights the associated audio source and clip in the Project browser and Hierarchy window.
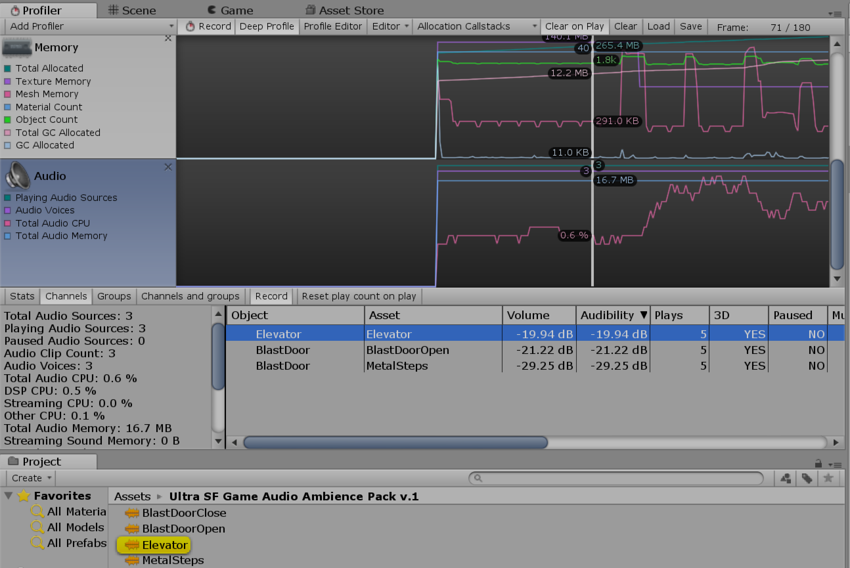 Channel view. When clicking a row the AudioClip Asset is highlighted first, then the AudioSource in the Hierarchy that played it.
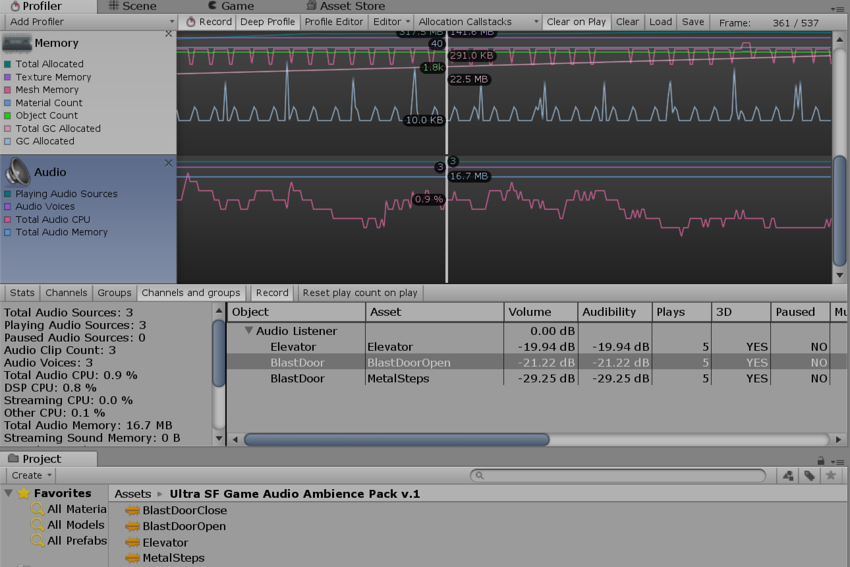 Channels and groups view. Here the AudioSource that played the sound in the selected row is highlighted.
Copyright © 2023 Unity Technologies
优美缔软件(上海)有限公司 版权所有
"Unity"、Unity 徽标及其他 Unity 商标是 Unity Technologies 或其附属机构在美国及其他地区的商标或注册商标。其他名称或品牌是其各自所有者的商标。
公安部备案号:
31010902002961