Memory Profiler module
There are two ways of analyzing memory usage in your application in Unity:
- Memory Profiler module: This built-in Profiler module gives you basic information on where your application uses memory.
- Memory Profiler package: This is a separate package that you can add to your Project. It adds an additional Memory Profiler window to the Unity Editor, which you can then use to analyze memory usage in your application in even more detail. You can store and compare snapshots to find memory leaks more easily, or see the memory layout to find memory fragmentation issues.
This page covers information on the built-in Memory Profiler module. For more information on the Memory profiler package, see the Memory Profiler documentation.
The Memory Profiler module visualizes counters that represent the total allocated memory in your application. You can use the memory module to see information like the number of loaded objects, and the memory that they take in total per category. You can also see the number of GC allocations per Profiler frame.
When you profile your application in the Editor, the information in the Memory module indicates the memory usage in the Editor. These numbers are generally larger than when running on the release platform, because running the Unity Editor uses specific objects that take up memory, and the Editor window itself uses extra memory. Additionally, the Profiler displays memory that it uses, because Unity cannot cleanly separate it from the memory that the Play mode Player uses. For more precise numbers and memory usage for your application, connect the Profiler to the running player via the Attach to Player menu. This allows you to see the actual usage on the target device.
Chart categories
The Memory module is divided into six charts that display detailed information on where your application spends memory. You can change the order of the categories in the chart; to do this, drag and drop them in the chart’s legend. You can also click a category’s colored legend to toggle its display.
| Category | Descripción |
|---|---|
| Total Allocated | The total memory your application has used. |
| Texture Memory | How much memory the Textures in your application have used. |
| Mesh Memory | How much memory the Meshes in your application have used. |
| Material Count | The number of Material instances in your application. |
| Object Count | The number of native object instances in your application. |
| GC Used Memory | The amount of memory used by the GC heap. |
| GC Allocated in Frame | The amount of memory allocated per frame on the GC heap. |
Module details pane
There are two views available in the module details pane, located at the bottom of the Profiler window: Simple and Detailed. To change the view, select it from the dropdown in the top left of the module details pane.
Simple view
The Simple view displays an overview of how Unity uses memory in real-time on a per-frame basis.
Unity reserves memory pools for allocations to avoid asking the operating system for memory too often. The Profiler displays how much memory is reserved, and how much Unity is using.
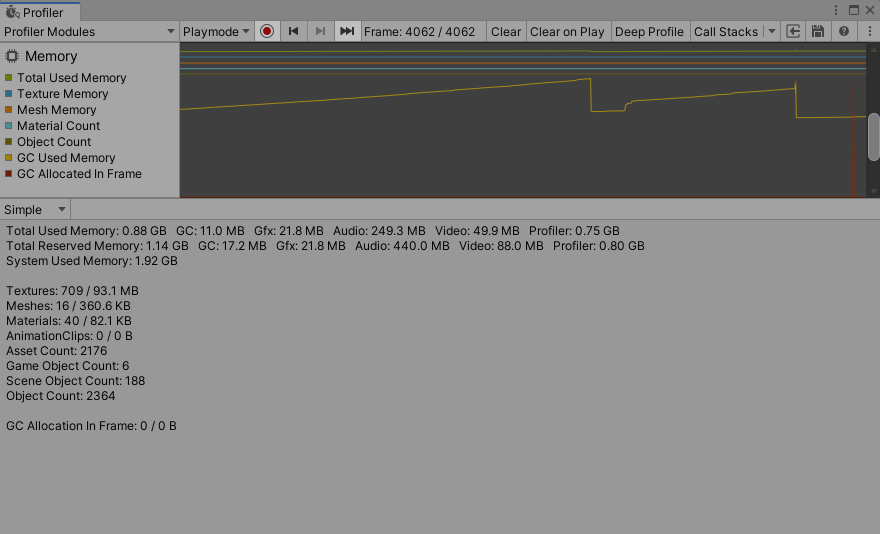
This information is also available via the ProfilerRecorder API and in the Profiler Module Editor so you can add them to a custom Profiler module.
| Statistic | Descripción | Available in Release Players |
|---|---|---|
| Total Used Memory | Total value of memory that Unity uses and tracks. | Sí |
| Total Reserved Memory | Total reserved memory that Unity uses for tracking purposes and pool allocations. | Sí |
|
GC Used Memory GC Reserved Memory |
The used heap size and total heap size that managed code uses. This memory is garbage collected. | Sí |
|
Gfx Used Memory Gfx Reserved Memory |
The estimated amount of memory the driver uses on Textures, render targets, Shaders, and Mesh data. | Sí |
|
Audio Used Memory Audio Reserved Memory |
The Audio system’s estimated memory usage. | Sí |
|
Video Used Memory Video Reserved Memory |
The Video system’s estimated memory usage | Sí |
|
Profiler Used Memory Profiler Reserved Memory |
The memory the Profiler functionality uses and reserves from the system. | Sí |
| System Used Memory | The values in the Profiler are different to those displayed in your operating system’s task manager, because the Memory Profiler does not track all memory usage in your system. This includes memory that some drivers and plug-ins use, and memory used for executable code. On platforms that support getting the total memory size of the application from the operating system, the System Memory Usage is over 0 and is the same size in a task manager. |
Sí |
|
Texture Count Texture Memory |
The total count of loaded textures and memory they use. | No |
|
Mesh Count Mesh Memory |
The total count of loaded meshes and memory they use. | No |
|
Material Count Material Memory |
The total count of loaded materials and memory they use. | No |
|
AnimationClip Count AnimationClip Memory |
The total count of loaded AnimationClips and memory they use. | No |
| Asset Count | The total number of loaded assets. | No |
| GameObject Count | The total number of GameObject instances in the scene. | No |
| Scene Object Count | The total number of dynamic UnityEngine.Objects. This number includes the GameObject Count, plus the total number of components, and everything which is not asset in the scene. |
No |
| Object Count | The total number of native UnityEngine.Objects that your application creates or loads. This number includes the Scene Object Count, plus the total number of all assets. If this number rises over time, your application is creating GameObjects or other assets and never destroying or unloading them. |
No |
|
GC Allocation In Frame Count GC Allocated In Frame |
Amount of managed allocations and its total size in bytes. | No |
Availability in Players
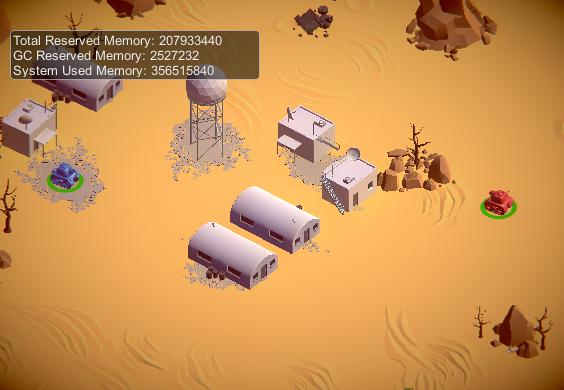
You can use the ProfilerRecorder API to access the Memory Profiler module’s counters in Players. The following example contains a simple script that collects “Total Reserved Memory”, “GC Reserved Memory” and “System Used Memory” metrics, and displays those as a GUI.TextArea. The Memory Profiler module information belongs to the ProfilerCategory.Memory Profiler category.
using System.Text;
using Unity.Profiling;
using UnityEngine;

public class MemoryStatsScript : MonoBehaviour
{
    string statsText;
    ProfilerRecorder totalReservedMemoryRecorder;
    ProfilerRecorder gcReservedMemoryRecorder;
    ProfilerRecorder systemUsedMemoryRecorder;

    void OnEnable()
    {
        totalReservedMemoryRecorder = ProfilerRecorder.StartNew(ProfilerCategory.Memory, "Total Reserved Memory");
        gcReservedMemoryRecorder = ProfilerRecorder.StartNew(ProfilerCategory.Memory, "GC Reserved Memory");
        systemUsedMemoryRecorder = ProfilerRecorder.StartNew(ProfilerCategory.Memory, "System Used Memory");
    }

    void OnDisable()
    {
        totalReservedMemoryRecorder.Dispose();
        gcReservedMemoryRecorder.Dispose();
        systemUsedMemoryRecorder.Dispose();
    }

    void Update()
    {
        var sb = new StringBuilder(500);
        if (totalReservedMemoryRecorder.Valid)
            sb.AppendLine($"Total Reserved Memory: {totalReservedMemoryRecorder.LastValue}");
        if (gcReservedMemoryRecorder.Valid)
            sb.AppendLine($"GC Reserved Memory: {gcReservedMemoryRecorder.LastValue}");
        if (systemUsedMemoryRecorder.Valid)
            sb.AppendLine($"System Used Memory: {systemUsedMemoryRecorder.LastValue}");
        statsText = sb.ToString();
    }

    void OnGUI()
    {
        GUI.TextArea(new Rect(10, 30, 250, 50), statsText);
    }
}
The following screenshot shows the result of adding the script to the Tanks! tutorial project.
This information is available in Release Players, as are the other high level counters in the table above. If you want to see the selected Memory counters in a custom module in the Profiler window, use the Module Editor to configure the chart.
Detailed view
The Detailed view provides a snapshot of your application’s current state. Click the Take Sample button to capture detailed memory usage for the current target. It takes the Profiler time to get this data, so the Detailed view does not give you real-time details. After the Profiler takes a sample, the Profiler window displays a list view where you can explore your application’s memory usage in more detail.
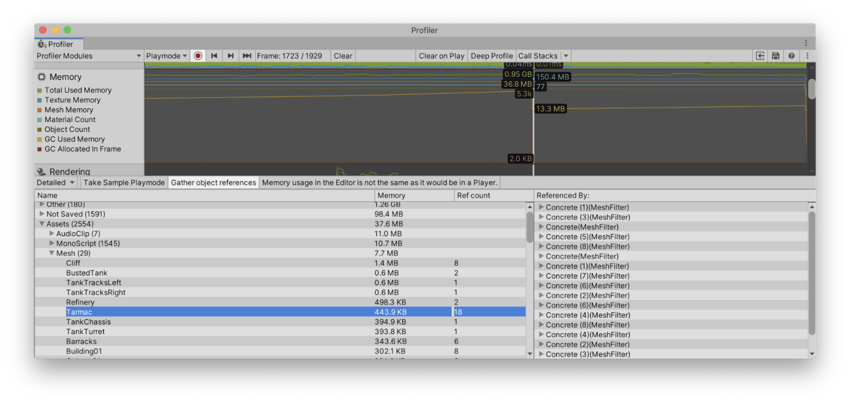
Enable the Gather object references setting at the top of the module details pane to collect information about what is referencing an object at the time of the snapshot. The Profiler displays this information in the right-hand pane of the window.
The list view divides objects that use memory into the following categories:
- Other: Objects that are neither Assets, GameObjects, or components. This includes information such as the memory Unity uses for different systems.
- Not Saved: Objects marked as DontSave
- Builtin Resources: Unity Editor resources or Unity default resources, such as Shaders you have added to the Always Included Shaders list of the Graphics settings.
- Assets: Assets referenced from user or native code.
- Scene Memory: Objects and attached components.
When you click on a GameObject in the Assets or Scene Memory list, it’s highlighted in the Project or Scene view.
Note: In the Other category, memory reported under System.ExecutableAndDlls is read-only memory. The operating system might discard these pages as needed and later reload them from the file system. This generates lower memory usage, and usually does not directly contribute to the operating system’s decision to close your application if it uses too much memory. Some of these pages might also be shared with other applications that are using the same frameworks.
Copyright © 2023 Unity Technologies
优美缔软件(上海)有限公司 版权所有
"Unity"、Unity 徽标及其他 Unity 商标是 Unity Technologies 或其附属机构在美国及其他地区的商标或注册商标。其他名称或品牌是其各自所有者的商标。
公安部备案号:
31010902002961