CPU Usage プロファイラーモジュール
CPU Usage プロファイラーモジュールには、アプリケーションのどこで時間が費やされているかを表示するチャートが含まれています。レンダリング、スクリプト、アニメーションなど、アプリケーションが時間を費やすすべての重要な領域の概要を提供します。このセクションには以下のトピックが含まれます。
チャートのカテゴリ
CPU Usage プロファイラーモジュールのチャートは、アプリケーションのメインスレッドで費やされた時間を追跡します。タイミングは 9 のカテゴリに分けられます。チャートのカテゴリの順序を変更するには、カテゴリをチャートの凡例にドラッグアンドドロップします。カテゴリの色の付いた凡例をクリックして、表示を切り替えることもできます。
| カテゴリ | 説明 |
|---|---|
| Rendering | アプリケーションがグラフィックスのレンダリングに費やす時間。 |
| Scripts | アプリケーションがスクリプトの実行に費やす時間。 |
| Physics | アプリケーションが物理演算エンジンに費やす時間。 |
| Animation | アプリケーションがアプリケーション内のスキンしたメッシュレンダラー、ゲームオブジェクト、その他のコンポーネントをアニメーション化するのに費やす時間。これには、Animation コンポーネントと Animator コンポーネントが使用するシステムが計算に要した時間も含まれます。 |
| GarbageCollector | アプリケーションが ガベージコレクター の実行に費やす時間。 |
| VSync | アプリケーションが targetFrameRate または次の VBlank との同期を待機するフレームごとの時間。これは、 QualitySettings.vSyncCount 値、ターゲットフレームレート、または VSync 設定 (アプリケーションが実行されているプラットフォームのデフォルト、または最大値) に基づいています。VSync の詳細については、このページの レンダリングと VSync のサンプル を参照してください。 |
| Global Illumination | アプリケーションがライティングに費やす時間。 |
| UI | アプリケーションが UI の表示に費やす時間。 |
| Others | アプリケーションが他のカテゴリに分類されないコードに費やす時間。これには、EditorLoop すべてや、エディターで再生モードをプロファイルするときのプロファイリングオーバーヘッドなどが含まれます。 |
モジュールの詳細ペイン
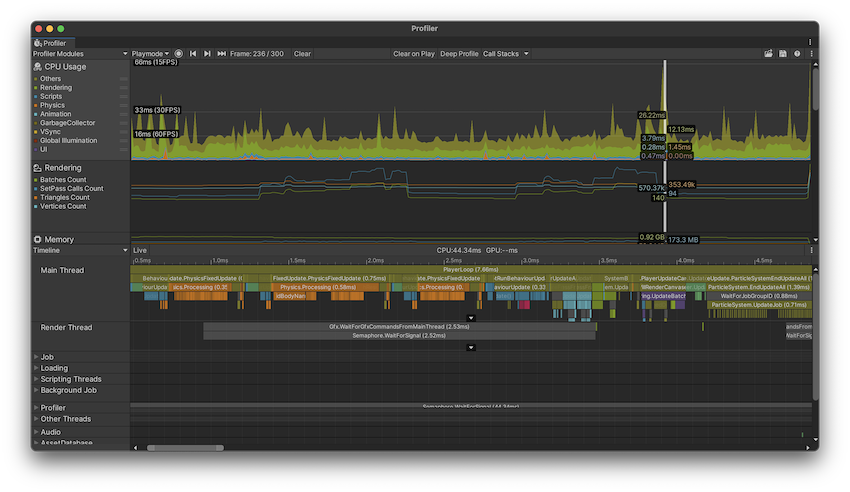
CPU Usage プロファイラーモジュールを選択すると、その下の詳細ペインに選択したフレームのアプリケーションが使った時間の内訳が表示されます。Timeline (タイムライン) か Detailed (詳細) の 2 通りでそのデータを表示できます。表示を変更するには、詳細ペインの左上のドロップダウンを使用します (デフォルトでは Timeline に設定)。
| 表示 | 機能 |
|---|---|
| Timeline | フレームの長さを時間軸にして、特定のフレームの時間消費の内訳を表示します。これは、すべてのスレッドのタイミングを一度に、またそれらが発生したフレーム内の時間内で表示するために使用できる唯一の表示モードです。そのため、スレッド (例えば、メインスレッドのシステムがスケジュールした後に起動する ジョブシステム ワーカースレッド) 間でタイミングを関連付けることができます。 |
| Hierarchy | 内部の階層構造によって時間のデータをグループ化します。このオプションは、アプリケーションが呼び出した要素を、使用された時間の降順 (デフォルト) のリスト形式で表示します。また、割り当てられたスクリプトのメモリの量 (GC Alloc)、または呼び出し回数で情報を並べ替えることもできます。表の並び方を決める列を変更するには、表の列のヘッダーをクリックします。 |
| Raw Hierarchy | 時間のデータを、タイミングが発生したコールスタックと同様の階層構造で表示します。Hierarchy ビューのように各コールスタックをマージせずに、このモードでは個別にリストします。 |
| Inverted Hierarchy | Groups samples by profiler marker and displays them with inverted sample stacks. The first level of the hierarchy shows an item for each profiler marker. Expand an item in the tree to show the markers that contain this one in their sample stack. This option helps to reveal larger performance issues caused by lots of instances of small performance impacts. These kinds of issues can be harder to spot in the Timeline or non-inverted hierarchy views. As with the other hierarchy views, click on column headers to order items. |
ライブ設定
ライブ 設定は各ビューで使用可能で、Playmode またはエディターで新しいデータの記録を開始すると、モジュールの詳細ペインに現在のフレームまたは選択したフレームに関する情報が表示されます。これを有効にするには、モジュールの詳細ドロップダウンの横にある Live ボタンをクリックします。デフォルトではこの設定は無効になっており、データを記録するときモジュールの詳細ペインは空白です。ノート: この設定により、Profiler ウィンドウが再描画されるときに EditorLoop のオーバーヘッドが増加します。
Show Scripting Method Names 設定
さらに、各ビューで More Items メニュー (⋮) を選択し、 Show Full Scripting Method Names を有効にすると、すべてのスクリプトメソッドのフルバージョンの名 (Assembly::Class::MethodName) が表示されます。
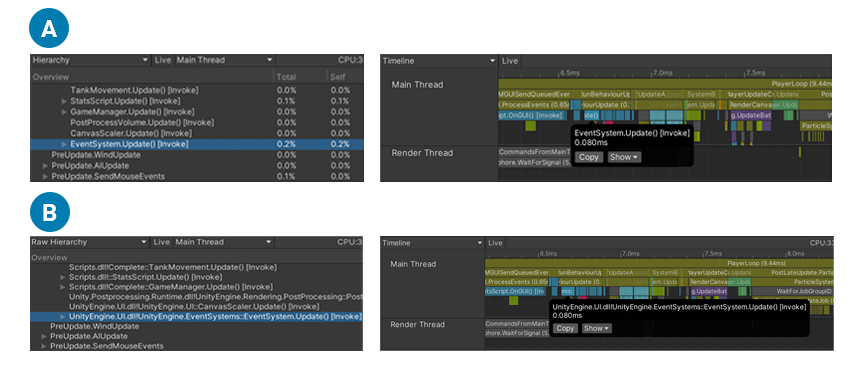
B: Hierarchy ビューと Timeline ビューのスクリプトメソッド。Show Full Scripting Method Names は有効。
Timeline ビュー
The Timeline view is the default view for the CPU Usage Profiler module. It contains an overview of where time is spent in your application and how the timings relate to each other.
Timeline ビューでは、Hierarchy ビューとは異なり、すべてのスレッドのプロファイリングデータを独自のサブセクションに同じ時間軸に沿って表示します。Hierarchy ビューには、一度に 1 つのスレッドのみ (デフォルトではメインスレッド) のプロファイリングデータが表示されます。また、Hierarchy ビューはサンプルの継続時間のみを表示しますが、Timeline ビューは各サンプルが発生した時間を表示します。
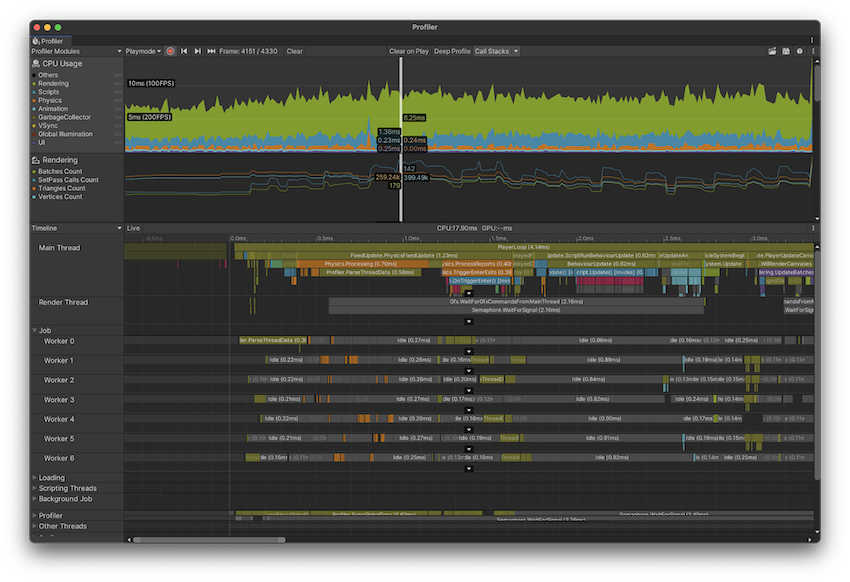
タイムラインビューを使用して、並列実行で異なるスレッドのアクティビティが互いにどのように相関しているかを確認できます。 Job Systemのワーカースレッドなど、さまざまなスレッドをどれだけ使用しているか、どれだけ使用しているか、スレッドでの作業がどのようにキューに入れられているか、アイドル状態(Idle サンプル)か、別のスレッドや待機中の スレッドがあるかを確認できます。ジョブの終了(Wait for x サンプル)
アイテムの操作と選択
時間軸のエリアを拡大するにはマウスのスクロールホイールを使用するか、Alt キーを押しながらマウスの右ボタンを押してドラッグします。水平スクロールバーの端を使用して拡大することもできます。ズームをリセットするにはキーボードの A キーを押します。すると、フレーム時間全体が表示されます。
スレッドの下部に白い矢印が表示されている場合は、クリックしてスレッドを展開するとすべての行が表示され、再度クリックすると一番上の行のみが表示されます。スレッドを分ける線をドラッグして、表示される行の数を再調整することもできます。行をダブルクリックすると、スレッドセクションの高さがコールスタックの最大の深さに設定されます。ビューをパンするには、マウスの中ボタンを押すか、 Alt キー (macOS では Command キー) を押しながらマウスの左ボタンを押します。
スレッドのグループを折りたたんだり展開したりするには、ビューの左端にあるスレッド名の横の折りたたみ矢印をクリックします。
CPU チャートに対する項目の寄与を表示するには、下のペインで項目を選択します。プロファイラーはその寄与を強調し、チャートの残りの部分を暗くします。項目の選択を解除するには、ビュー内の任意の場所をクリックします。F キーを押すと、選択した現在のサンプルにフォーカスが移動します。何も選択しない場合は、デフォルトのズームレベルで表示されます。
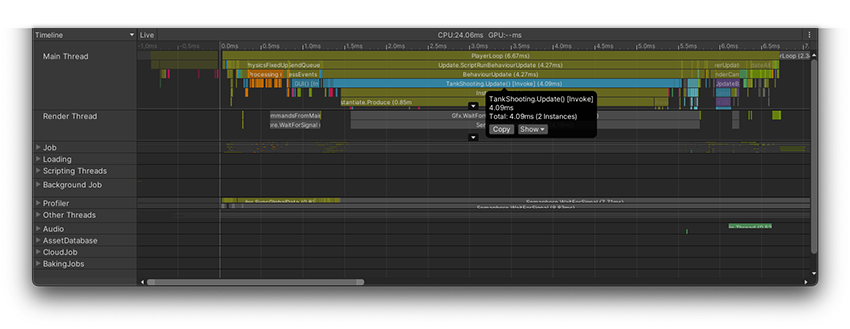
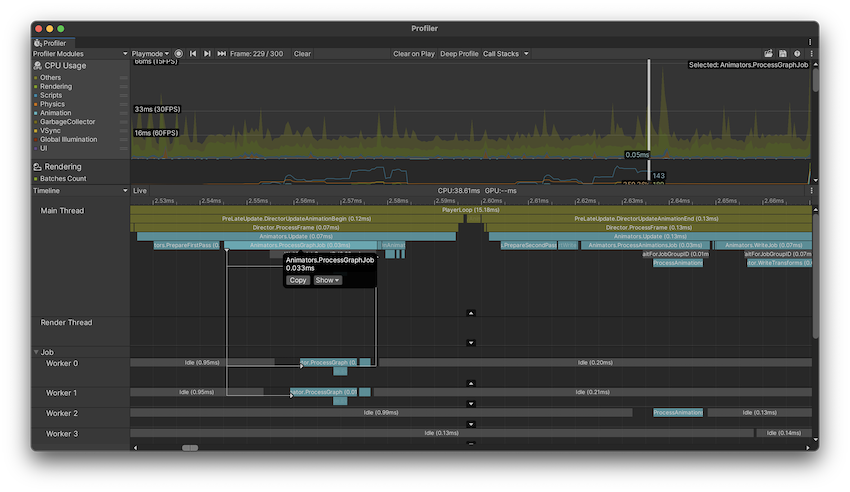
In the image above, the tooltip on the selected sample provides further details, such as the number of instances and the total time of this sample across all threads. You can select the text within the tooltip and copy it as well as use the buttons to interact with the sample further:
| Operation | 説明 |
|---|---|
| Copy | Copy the call stack and the entire content of the tooltip to your clipboard. |
| Show | Select this dropdown to choose from the following options: |
| Hierarchy | Switch to this sample in Hierarchy view |
| Raw Hierarchy | Switch to this sample in Raw Hierarchy view |
| Inverted Hierarchy | Switch to this sample in Inverted Hierarchy view |
| Full Details for Call Stacks | Unity records call stacks as a list of method pointer addresses, which it uses to display the method name, file path, and line number of the stack. Whenever only the pointer address is present, Unity ignores it to conserve screen space for the actionable items that have further information available. Enable this property to see the full list of method pointer addresses of the call stack. |
| Selected Sample Stack | View the details of the sample stack. Unity opens this information in a separate window. You can then copy the sample stack information to your clipboard. The sample stack differs from a method’s call stack because Unity does not tie every sample to a specific method, nor does it record every call as a sample. If you select a sample in a different frame and there isn’t a sample with the same sample stack in the displayed frame, this window shows both the sample stack of the original selection, as well as the approximate selection for this frame. |
GC.Alloc samples appear colored in red-magenta, and show you the size of the allocation.
マネージコールスタックをツールチップに表示するには、Profiler ウィンドウのツールバーに移動し、Call Stacks ボタンを選択します。フレームのコールスタックを表示するには、フレームをプロファイルする前にこのプロパティを有効にする必要があります。詳細については、コールスタック を参照してください。
Flow Events
Unity がスレッド間でどのようにジョブをスケジュールするかを視覚化するために、Flow Events の設定を使用できます。この設定では、システム、ジョブ、スレッドの関係が表示されます。この設定を有効にするには、タイムライン表示ペインの右上にある More メニュー (⋮) を選択し、Show Flow Events を選択します。
この設定を有効にすると、ジョブをスケジュールしたり、スケジュールされたジョブが完了するのを待ったりする Profiler サンプルに、白いイベントマーカーが追加されます。また、関係ないサンプルを暗くすることで、選択したサンプルをよりわかりやすく可視化することができます。
プロファイラーがサンプルに加える矢印の種類は 3 つあります。
- 下矢印: フローの始まりを示し、このサンプルが何らかの作業を予定していることを示します。
- 右矢印: フローの中で次の項目を示し、これを予定したのは別のサンプルであることを示します。
- 上矢印: フローの終わりを示し、このサンプルで作業が終了、または同期したことを示します。
サンプルを選択すると、プロファイラーは関連するフローイベントマーカーを線でつなぎます。太い線は、選択した特定のフローラインを強調します。例えば、begin のサンプルが他の 2 つの next のサンプルを指している場合、next のサンプルの 1 つをクリックすると、Profiler はそのサンプルに向かって太い線を引きます。
このビューは、コードの実行のフローや、どの作業が完了するのを待機しているかを見つけたり、コードの依存関係を視覚的に明らかにするのに役立ちます。
Hierarchy views
When you switch to the Hierarchy, Raw Hierarchy or Inverted Hierarchy view, your selection carries over, as long as the sample is on the main thread. If you cannot immediately find your selection, press the F key to focus it.

The Hierarchy view lists all samples you have profiled and groups them together by their shared call stack and the hierarchy of ProfilerMarkers. The Raw Hierarchy view does not group samples together, which makes it ideal for looking into samples on a granular level.
The Inverted Hierarchy view groups samples by profiler marker and displays them with inverted sample stacks. The first level of the hierarchy shows an item for each profiler marker. Expand an item in the tree to show the markers that contain this one in their sample stack. This option helps to reveal larger performance issues caused by lots of instances of small performance impacts. These kinds of issues can be harder to spot in the Timeline or non-inverted hierarchy views. As with the other hierarchy views, click on column headers to order items.
In all of the hierarchy views, you can use the Thread dropdown to select a specific thread, like the Main Thread or Render Thread to inspect in these views.
By default, all EditorOnly samples are collapsed in these views. EditorOnly samples are samples in the Player Loop that only happen because of Editor-only safety checks. When the samples are collapsed, their GC.Alloc value does not contribute to the GC.Alloc value of their enclosing sample. To display these samples, select the More Items menu (⋮) in the top right of the details pane, and then disable the Collapse EditorOnly Samples setting. For more information, see Editor only samples.
The hierarchy views display the following detailed information for each item in the Hierarchy, next to each row:
| プロパティ | 機能 |
|---|---|
| Total | The total amount of time Unity spent in a particular sample, as a percentage of the total frame time. |
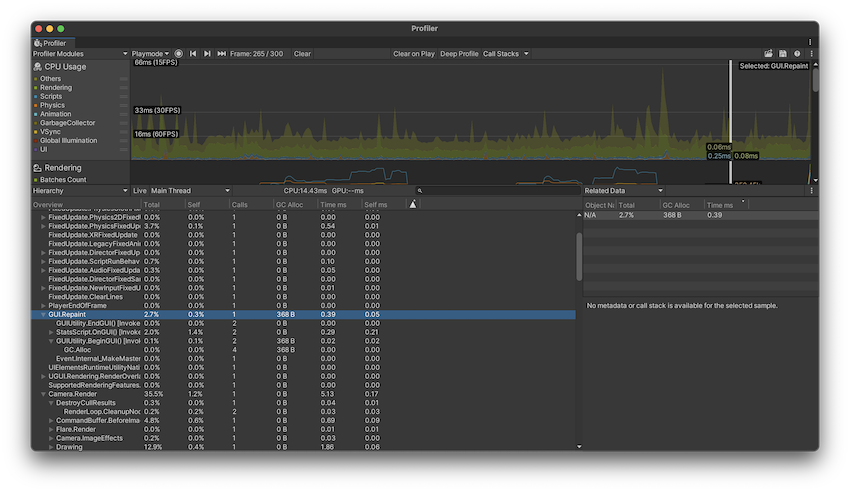
| Self | The total amount of time Unity spent in a particular sample as a percentage of the total frame time, excluding the time from sub-samples. For example, in the screenshot, 16.7% of time is spent in the Camera.Render function. This is because it calls a lot of drawing and culling functions. However, when you exclude the samples for the functions it calls, only 0.2% of time is spent on the Camera.Render function itself. |
| Calls | The number of calls made to this sample in this frame. In the Raw Hierarchy view the values in this column are always 1 because the Profiler does not merge the hierarchy of samples. |
| GC Alloc | Unity が現在のフレームに割り当てたスクリプティングのヒープメモリの量。スクリプティングのヒープメモリは、ガベージコレクタ によって管理されます。 Unity が GC.Collect() を呼び出すか、ヒープの現在のサイズに収まらないスクリプティングヒープの割り当てがある場合は常に、ガベージコレクターが起動します。参照がなくなったすべての割り当てにマークを付けて収集します。このプロセスは、プロファイラーで GC.Collect サンプルとして表示されます。Unity は、アプリケーションがヒープにより多くを割り当てると、ガベージコレクターをより頻繁に実行します。 マネージヒープが増加すると、Unity がメモリにマークして回収するのに時間がかかります。そのため、アプリケーションの実行中は GC Alloc 値をゼロに保ち、ガベージコレクターがアプリケーションのフレームレートに影響を与えないようにし、全体的なヒープサイズを小さく保つ必要があります。 マネージヒープの詳細については、マネージメモリ のドキュメントを参照してください。 |
| Time ms | The total amount of time Unity spent in a particular sample, in milliseconds. If your application uses the Job System or multithreaded rendering, this information might be misleading, because it only contains the time Unity spent on the currently selected thread. To change the thread, select the Thread dropdown at the top of the Hierarchy pane. |
| Self ms | The total amount of time Unity spent in a particular sample, in milliseconds, excluding the time Unity spends calling sub-functions. |
| Warning | Indicated by a warning icon, this displays how many times the application has triggered a warning during the current frame. For more information, see Performance warnings. |
In the Inverted Hierarchy view, each child item displays information relative to its parent item. Each child item in the tree represents part of an inverted sample stack and its data shows how much time or heap memory is contributed via this sample stack to the aggregated parent item. The following scenario illustrates this process.
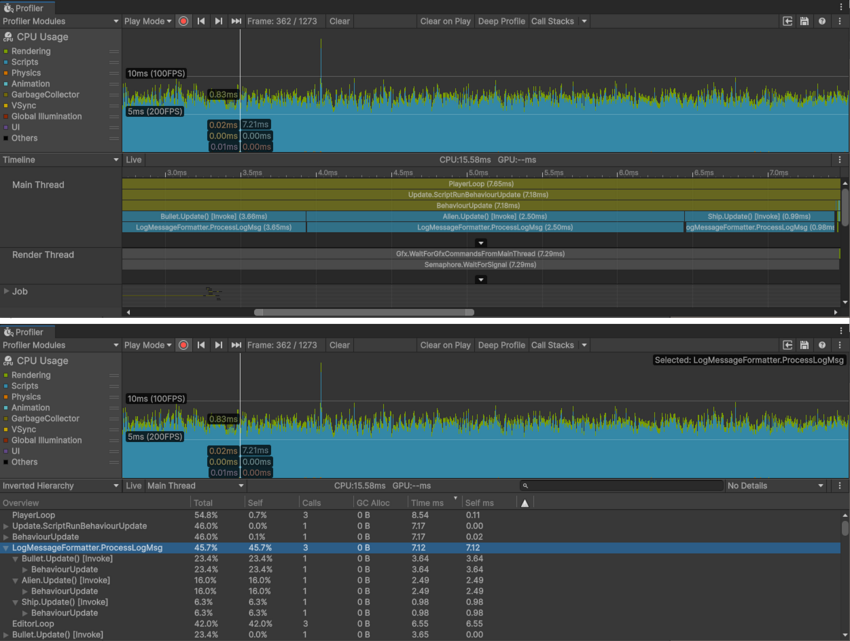
Bullet.Update(), Alien.Update() and Ship.Update() all call a method named LogMessageFormatter.ProcessLogMsg, which executes in a different amount of time on each occasion. In the Inverted Hierarchy view, the LogMessageFormatter.ProcessLogMsg samples are combined into a single root item which shows the total time spent inside all instances of the sample during the frame. The tree expands to show each of the three sample stacks that led to this sample and the time that each stack contributes to the overall time.
To keep this example short, LogMessageFormatter.ProcessLogMsg is only called three times and has a relatively long execution time. However, if this method executed much faster and was called many times in a frame, its total execution time could still contribute significantly to the overall frame time. In such situations, the Inverted Hierarchy view makes the relevant markers much easier to identify.
Related data
アプリケーションがプロファイルされた関数をどこで呼び出し、使用するかに関する詳細情報を取得するには、モジュールの詳細ペインの右上にある Details ドロップダウンを選択し、Related Data か Calls ビューのいずれかを選択します。
The Related Data view displays a list of UnityEngine.Objects that use a Begin() overload and are associated with the Profiler sample. Some samples that Unity reports have these associations built in, such as Camera.Render samples that are linked to the Camera GameObject that does the rendering. Unity reports these objects via their instance ID and resolves them to a name in the Profiler window, if you profile in the Editor.
これらのオブジェクトの 1 つをクリックすると、Unity はシーンの Hierarchy を使ってオブジェクトを検索し、ping しようとします。アソシエーションはインスタンス ID を使用するため、ping はアプリケーションがエディターでプロファイルされている場合と、 オブジェクトがまだ存在している場合にのみ機能します。
For GC.Alloc samples, this view displays a list of N/A items, one for each allocation that happened at this hierarchy level, with the size of the allocation listed in the GC.Alloc column. If you profile your application with the Call Stacks setting enabled, when you select a GC.Alloc sample in this view, the Profiler window displays the call stack for the allocated scripting object you select, even if you did not enable the Deep Profiling setting. For more information, see the Allocation call stacks section of this documentation.

The Calls view displays where the selected sample is being called from as well as what other functions it calls to.
コールスタック
ProfilerMarkers emit a set of samples which the Profiler uses to display and organize profiling information into different chronological and hierarchical views. Any sample displayed in the Profiler window is therefore part of a sample stack.
A sample stack differs from a method’s call stack because Unity does not tie every sample to a specific method, nor does it record every call as a sample. Deep Profiling adds a ProfilerMarker to every function call, but it does not add any for native code, plus recording all of these samples comes with a potentially high overhead.
GC.Alloc、UnsafeUtility.Malloc、JobHandle.Complete が出力するサンプルのすべてのコールスタックを有効にすることができます。これは、ディーププロファイリングを有効にして高いオーバーヘッドを発生させることなく、これらのサンプルがどこで発生したかを追跡したい場合に便利です。これらのマーカーの詳細については、よく使われるプロファイラーマーカー のドキュメントを参照してください。
To enable full call stacks for these samples, navigate to the toolbar of the Profiler window and enable the Call Stacks button. By default, this enables the call stacks for GC.Alloc samples. To enable other call stacks, select the dropdown arrow and enable any of the other markers you would like to see the call stacks for.
この機能は、エディターでプロファイルする場合でも、実行中のプレイヤーでプロファイルする場合でも使用できます。この機能は、これをオンにしたときのみフレームに対し有効です。
For example, every scripting heap allocation shows up as a GC.Alloc sample in both the Hierarchy view and Timeline view. In the Timeline view, it is colored bright magenta. To see a call stack, select the CPU Profiler module and then select a GC.Alloc sample in Timeline view. The call stack appears in the selection highlight.
To copy the call stack, select the Copy button in the tooltip. You can also open the relevant code file from this view if the file path is highlighted as a blue link. Click on the link and the file opens in your default IDE. Note: The call stack information does not contain the exact line number within that method but just the line at the beginning of that method.
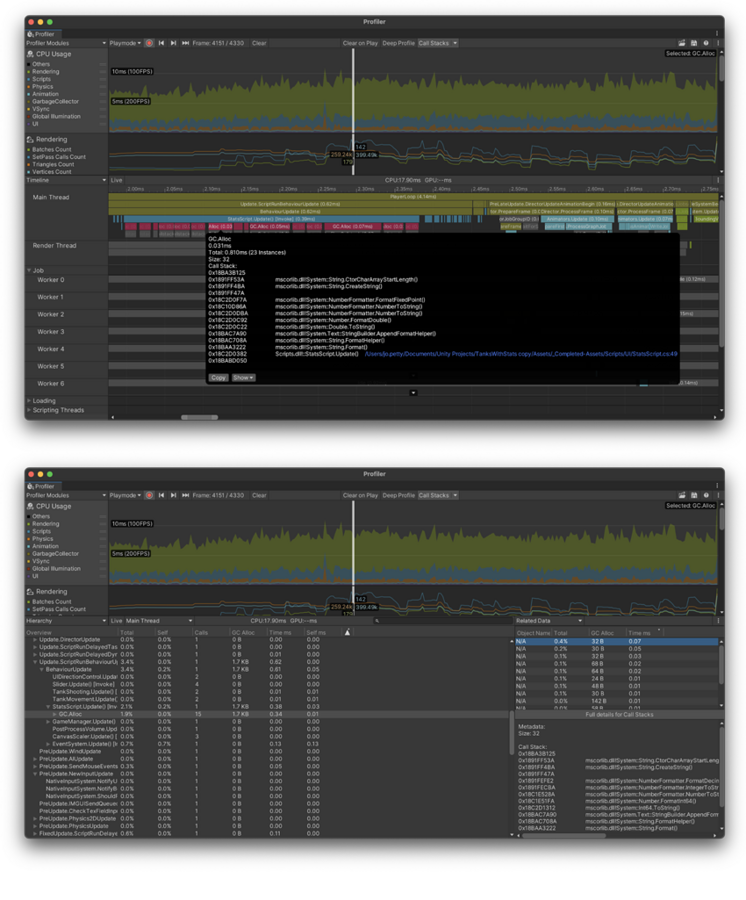
You can also use the Show dropdown to see the GC.Alloc’s sample stack, its full details, or switch to view it in the Hierarchy or Raw Hierarchy view.
完全なコールスタックの詳細を見るには、Hierarchy または Raw Hierarchy ビューで、 Details ビューを Related Data に設定します。このビューでは、このサンプルに関連するメタデータが一覧表示されます。このメタデータには、関連する UnityEngine.Object が含まれる場合があります。UnityEngine.Object に関連付けられていないメタデータエントリーについては、このパネルに N/A と表示されます。N/A エントリーを選択すると、プロファイラーは詳細ビューの下半分にコールスタックを含むメタデータを表示します。
マネージアロケーションの詳細については、マネージメモリt を参照してください。
一般的なマーカー
Unity のコードには数多くのプロファイラーマーカーが用意されており、アプリケーションで何に時間がかかっているかを知ることができます。プロファイリングデータに表示される可能性のある最も一般的なマーカーの完全なリストについては、よく使われるプロファイラーマーカー のドキュメントを参照してください。
Copyright © 2023 Unity Technologies
优美缔软件(上海)有限公司 版权所有
"Unity"、Unity 徽标及其他 Unity 商标是 Unity Technologies 或其附属机构在美国及其他地区的商标或注册商标。其他名称或品牌是其各自所有者的商标。
公安部备案号:
31010902002961