Memory
Memory consumption is a critical performance indicator, and is especially important on platforms with limited memory resources, such as low-end mobile devices.
Profiling memory consumption
Diagnosing memory issues in Unity is best performed with an open-source memory visualization tool available from Unity’s Bitbucket. Integration of this tool is as simple as downloading the linked repository and dropping the included Editor folder into a project.
The tool can be used with any version of Unity from 5.3 onwards. It can capture a wealth of information on native- and managed-code memory consumption when attached to an application built with IL2CPP.
To use the tool, simply build a project with an IL2CPP scripting backend and deploy it to the appropriate device. Attach Unity’s regular in-editor CPU profiler, then open the Memory Profiler window (menu: Window > MemoryProfilerWindow) and selet Take Snapshot.
The application on device pauses for a short time as data is gathered and transmitted to the Unity Editor. Then, the Unity Editor pauses to parse the received data; this can require a significant amount of time. For very memory-intensive applications, a trace might require 10–30 minutes to be parsed.
During this parse-and-load operation, patience is recommended.
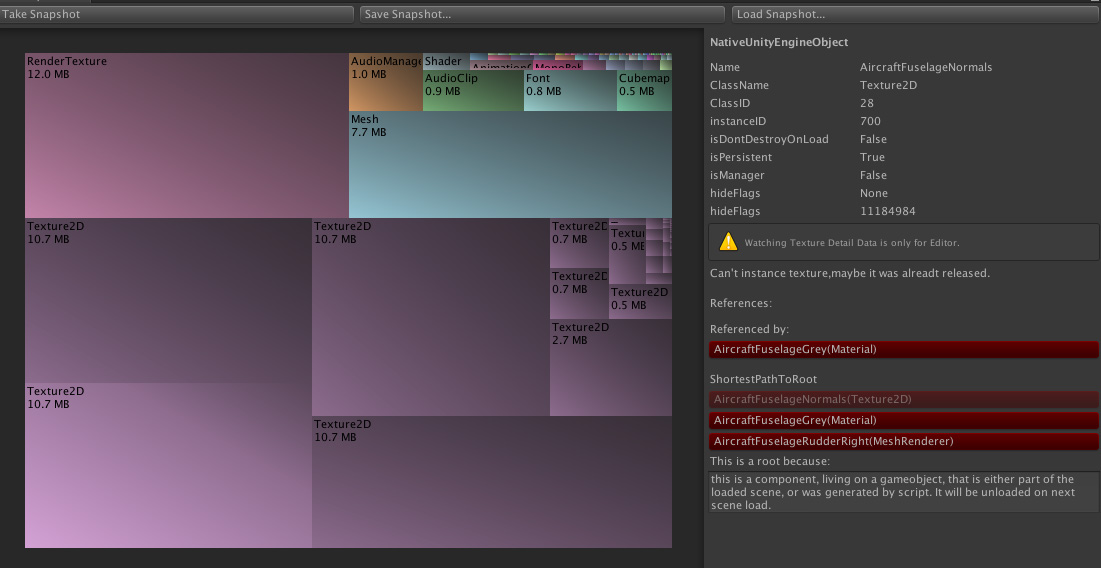
This screenshot is from a Standard Assets Scene running on an iOS device, and shows that over three-quarters of memory usage is attributable to four very large Textures, all related to the aircraft’s fuselage.
This visualization can be zoomed. Click each box in the application to see more information about it.
Identifying duplicated Textures
One common memory problem is the duplication of Assets in memory. As Textures are often the most memory-intensive Assets in a project, Texture duplication is one of the most common memory problems found in Unity projects.
Duplicated Assets can be identified by locating two objects of the same type and same size, which appear to have been loaded from the same Asset. In the detail pane of the new Memory Profiler, examine the Name and InstanceID fields of the seemingly-identical objects.
The Name field is based on the name of the Asset file from which the object was loaded; generally, it is the file name without the file’s path or extension. The InstanceID field indicates the internal identification number assigned by the Unity runtime; this number is unique during a single run of a Unity game(1).
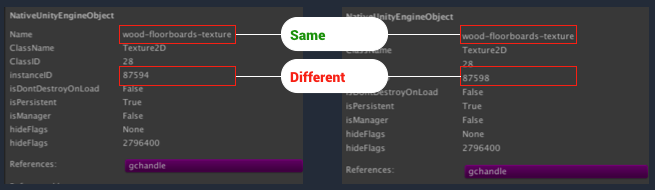
This diagram demonstrates a simple example of this problem. On the left and right sides of the diagram are screenshots taken from the Detail pane of the 5.4 Memory Profiler. The Assets shown in these screenshots are two Textures loaded separately in memory. The Textures have identical names and sizes, suggesting that they may be duplicates. By examining the project’s “Assets” folder, it can be determined that there is only one Asset file named wood-floorboards-texture, which very strongly points towards asset duplication.
Each individual UnityEngine.Object in memory has a unique instance ID, assigned to it when the object is created. As these two Textures have different instance IDs, it is certain that they represent two different sets of Texture data that are loaded into memory.
As the file names and Asset sizes are identical, while the instance IDs are different, it is certain that these two objects represent a Texture that has been duplicated in memory (NOTE: If there are Textures with identical filenames in the project, then this judgment is not absolute, but still strongly suggestive when correlated with the identical file sizes.).
AssetBundles and Asset duplication
The most common cause of Texture and Asset duplication in memory is the improper unloading of AssetBundles. See Unity’s Best Practice Guide on AssetBundles for a description of this problem. The key section is Managing Loaded Assets.
Examining image buffer, Image Effect & RenderTexture memory usage
It is also possible to visualize the memory required to provide render buffers to Image Effects and RenderTexture objects in the memory visualizer.
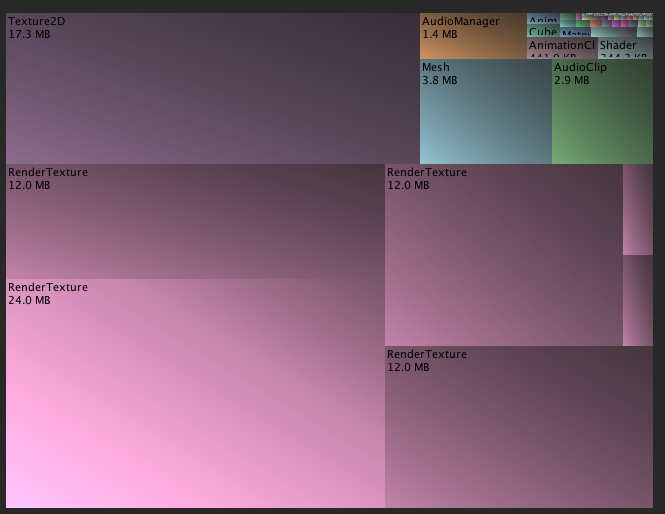
The above screenshot demonstrates a simple Scene with a handful of Unity’s Cinematic Image Effects applied to it. The Image Effects allocate temporary render buffers in order to perform their computations; in particular, the Bloom effect allocates several buffers of decreasing size. Due to the high resolution of Retina iOS devices, these temporary buffers consume significantly more memory than the rest of the project combined.
Consider that an iPad Air 2 renders at 2048x1536 – this is beyond the 1080p resolution often targeted on modern consoles and PCs, but is running on a tablet device. A full-screen temporary render buffer consumes a full 24 or 36 megabytes of memory, depending on the format of the buffer. This can be reduced by 75% by halving the pixel dimensions of the render buffer. This often does not significantly degrade the visual quality of the result.
One way to optimize Image Effects’ use of temporary render buffers and other GPU resources is to create a single “uber” Image Effect that performs all of the disparate calculations at once. When using Unity 5.5 or newer, it is possible to use the new UberFX (available from github package; this package provides a configurable “uber” Image Effect that can perform all of the operations provided by the Cinematic Image Effects with less overhead than individual Image Effects.
Copyright © 2023 Unity Technologies
优美缔软件(上海)有限公司 版权所有
"Unity"、Unity 徽标及其他 Unity 商标是 Unity Technologies 或其附属机构在美国及其他地区的商标或注册商标。其他名称或品牌是其各自所有者的商标。
公安部备案号:
31010902002961