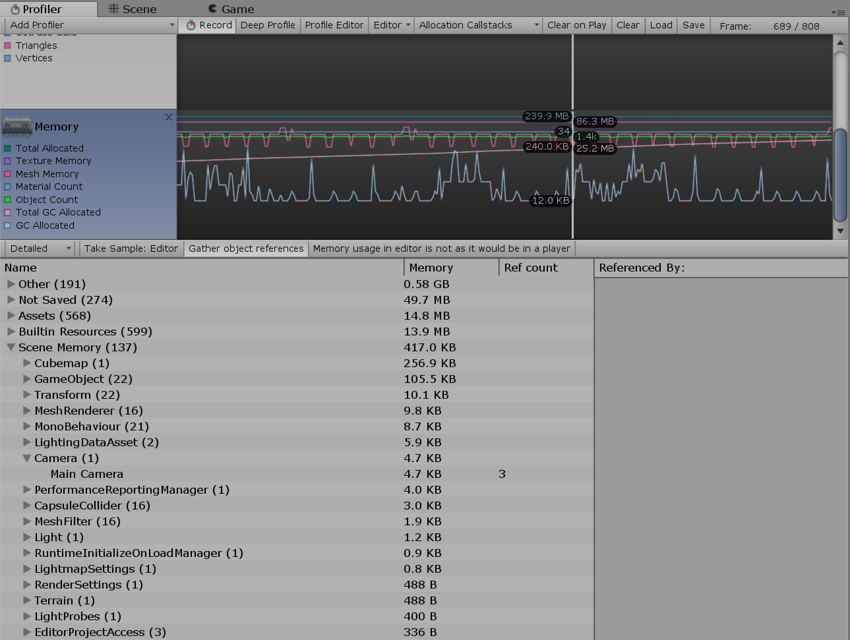
Memory Profiler
There are two modes you can use in the Memory ProfilerA window that helps you to optimize your game. It shows how much time is spent in the various areas of your game. For example, it can report the percentage of time spent rendering, animating or in your game logic. More info
See in Glossary to inspect the memory usage of your application. This is selected in the dropdown in the top-left of the lower panel.
Simple
The Simple view shows a simple overview how memory is used throughout Unity in real-time on a per-frame basis.

Unity reserves memory pools for allocations in order to avoid asking the operating system for memory too often. This is displayed as a reserved amount, and how much is used.
The areas covered by this are:
- Unity The amount of memory tracked by allocations in native Unity code
- Mono The total heap size and used heap size used by managed code. This memory is garbage-collected
-
GfxDriver The estimated amount of memory the driver is using on Textures, render targets, ShadersA small script that contains the mathematical calculations and algorithms for calculating the Color of each pixel rendered, based on the lighting input and the Material configuration. More info
See in Glossary and MeshThe main graphics primitive of Unity. Meshes make up a large part of your 3D worlds. Unity supports triangulated or Quadrangulated polygon meshes. Nurbs, Nurms, Subdiv surfaces must be converted to polygons. More info
See in Glossary data. - FMOD The Audio driver’s estimated memory usage
- Profiler Memory used for the Profiler data
The numbers that are displayed are not the same as the Task Manager or Activity Monitor, because some usage is untracked by the Memory Profiler. This includes memory used by some drivers, and memory used for executable code.
Memory statistics are shown for some of the most common AssetAny media or data that can be used in your game or Project. An asset may come from a file created outside of Unity, such as a 3D model, an audio file or an image. You can also create some asset types in Unity, such as an Animator Controller, an Audio Mixer or a Render Texture. More info
See in Glossary/object types. These stats include the count and the used memory (main and video memory):
- Textures
- Meshes
- Materials
- Animations
- Audio
- Object Count
Object Count is the total number of objects that are created. If this number rises over time, your game is creating some objects that are never destroyed.
Detailed
The Detailed view allows you take a snapshot of the current state. Use the Take Sample button to capture detailed memory usage. Obtaining this data takes some time, so the Detailed view should not be expected to give you real-time details. After taking a sample, the Profiler window is updated with a tree view where you can explore memory usage.

This displays individual Assets and GameObjectThe fundamental object in Unity scenes, which can represent characters, props, scenery, cameras, waypoints, and more. A GameObject’s functionality is defined by the Components attached to it. More info
See in Glossary memory usage. It also displays a reason for a GameObject to be in memory. Common reasons include:
- Assets: Asset referenced from user or native code
- Built-in Resources: Unity Editor resources or Unity default resources
- Not Saved: GameObjects marked as DontSave
-
SceneA Scene contains the environments and menus of your game. Think of each unique Scene file as a unique level. In each Scene, you place your environments, obstacles, and decorations, essentially designing and building your game in pieces. More info
See in Glossary Memory: GameObject and attached components - Other: GameObjects not marked in the above categories
Click on a GameObject in the list to view it in either the Project or the Scene viewAn interactive view into the world you are creating. You use the Scene View to select and position scenery, characters, cameras, lights, and all other types of Game Object. More info
See in Glossary.
When profiling in the Editor, all numbers displayed by the Memory Profiler indicate the memory usage in the Editor. These are generally larger than when running in a player, because running the Unity Editor adds extra memory. For more precise numbers and memory usage for your app, use the Profiler connection to connect to the running player. This will give the actual usage on the target device.
Memory reported under System.ExecutableAndDlls is read-only memory, so the operating system might discard these pages as needed and later reload them from the file system. This generates lower memory usage, and usually does not directly contribute to the operating system’s decision to kill the application. Some of these pages might also be shared with other applications that are using the same frameworks.