Memory プロファイラーモジュール
Unity でアプリケーションのメモリ使用量を分析する方法は 2 つあります。
- Memory Profiler module: A built-in Profiler module that gives you basic information on where your application uses memory.
- Memory Profiler package: A Unity package that you can add to your project. It adds an additional Memory Profiler window to the Unity Editor, which you can then use to analyze memory usage in your application in even more detail. You can store and compare snapshots to find memory leaks, or see the memory layout to find memory fragmentation issues.
このページではビルトインの Memory プロファイラーモジュールについて説明します。Memory Profiler パッケージの詳細は、Memory Profiler のドキュメント を参照してください。
The Memory Profiler module visualizes counters that represent the total allocated memory in your application. You can use the memory module to see information like the number of loaded objects, and the memory that they take in total per category. You can also see the number of GC allocations per Profiler frame.
Memory profiling in the Editor
When you profile your application in the Editor, rather than building and profiling your application on a target device, the profiling data in the Memory Profiler module is larger than when you run your application on its release platform. This is because the Unity Editor uses specific objects that take up memory, and the Editor window itself uses extra memory.
Also, because Unity can’t cleanly separate the memory that the Profiler itself takes up from the Play mode’s memory, memory that the Profiler uses is displayed in the Profiler window. To remind you of this, a warning displays at the top of the Memory Profiler module details pane whenever you have the Profiler target set to Play Mode or Editor. For more precise numbers and memory usage for your application, you should profile your application on the target device and operating system you intend it to run on. For more information, see the documentation on Profiling your application.
チャートのカテゴリ
The Memory Profiler module is divided into categories that display detailed information on where your application spends memory. You can also click a category’s colored legend to toggle its display.
| カテゴリ | 説明 |
|---|---|
| Total Allocated | アプリケーションが使用する合計メモリ |
| Texture Memory | アプリケーションの テクスチャ が使用するメモリ量 |
| Mesh Memory | アプリケーションの メッシュ が使用するメモリ量 |
| Material Count | アプリケーションの マテリアル のインスタンス数 |
| Object Count | アプリケーションのネイティブのオブジェクトのインスタンス数 |
| GC Used Memory | The amount of memory the GC heap has used. |
| GC Allocated in Frame | GC ヒープのフレームごとに割り当てられたメモリ量 |
モジュールの詳細ペイン
There are two views available in the module details pane, located at the bottom of the Profiler window:
- Simple: Displays a high level overview of the memory statistics per frame
- Detailed: Captures a memory snapshot which contains more details on the memory that native objects used, including native references to them, and Unity’s different subsystems.
To change the view, select it from the dropdown in the top left of the module details pane.
簡易ビュー
The Simple view displays an overview of how Unity uses memory in real-time on a per-frame basis. It breaks down the total memory that your application uses into a few major categories. The Total value is based on the System Used Memory Profiler counter, which indicates how much memory the operating system (OS) reports as being in use by your application.
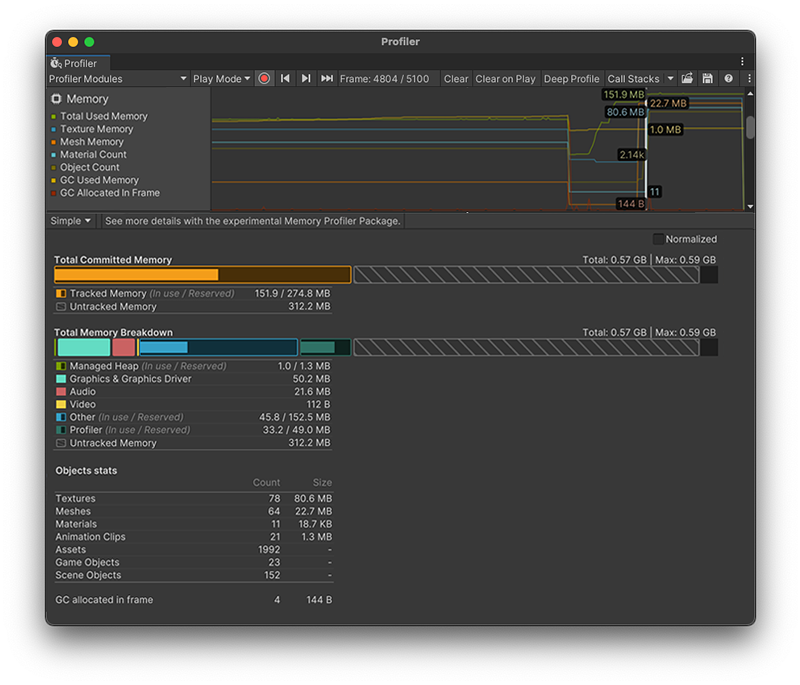
Unity sets some memory pools aside for allocations to avoid asking the operating system for memory too often. The Profiler module displays how much memory Unity reserves, and how much memory Unity used at the time of the Profiler capture.
The Simple view displays the data collected within the System Used Memory Profiler counter. This indicates how much memory the operating system (OS) reports as being in use by the app and corresponds to the Total value of the Total Committed Memory bar and the Total Memory Breakdown bar.
On platforms that support getting the total memory size of the application from the operating system, the System Memory Usage is over 0 and is the same size in a task manager.
The following reference table describes the statistics available in the Simple view, plus its corresponding profiler counter, and availability in Release builds. This information is also available via the ProfilerRecorder API and in the Profiler Module Editor so you can add them to a custom Profiler module.
| プロパティ | 説明 | Corresponding Profiler counter | Available in Release Players? |
|---|---|---|---|
| Normalized | Enable this setting to scale the Total Committed Memory and Total Memory Breakdown charts to the memory usage of the selected frame. If you disable this setting, the charts scale to the total used memory within the frame range. This setting can help you see how the total or relative amounts of memory change from frame to frame | 該当なし | 該当なし |
| Total Committed Memory | The length of the Total Committed Memory bar indicates the total amount of memory that Unity’s Memory Manager system tracked, how much of that it used, and how much memory isn’t tracked through this system. | System Used Memory | あり |
| Tracked Memory (in use / Reserved) | Indicates the total amount of memory that Unity uses and tracks (in use), and the amount of memory that Unity reserves for tracking purposes and pool allocations (Reserved). | Total Used Memory Total Reserved Memory |
あり |
| Untracked Memory | Indicates the total amount of memory that Unity used but isn’t aware of. Some examples of untracked memory are: - Memory allocated through native plug-ins or some drivers - Mono or IL2CPP type metadata - Memory that executable code and DLLs use The Memory Profiler package and native platform providers might have more information on some of these untracked memory amounts. |
該当なし | 該当なし |
| Total Memory Breakdown | Displays the same total amount as the Total Committed Memory bar but breaks it into some high level categories, based on which subsystems Unity allocated the memory for. Not all memory systems use pools or differentiate between used and reserved memory. Those that do display two numbers, the used and the reserved amount of memory. If the used amount doesn’t share the same unit (B, MB, GB) as the reserved amount, Unity displays the unit, otherwise it’s omitted. |
System Used Memory | あり |
| Managed Heap (in use / Reserved) | The used heap size and total heap size that managed code uses. This memory is garbage collected. | GC Used Memory GC Reserved Memory |
あり |
| Graphics & Graphics Driver | ドライバーがテクスチャ、レンダーターゲット、シェーダー、メッシュデータに使用している推定メモリ量。 | Gfx Used Memory Gfx Reserved Memory |
なし |
| オーディオ | オーディオシステムの推定メモリ使用量。 | Audio Used Memory Audio Reserved Memory |
あり |
| Video | The Video system’s estimated memory usage. | Video Used Memory Video Reserved Memory |
あり |
| Other | Displays native memory that Unity tracks, but isn’t reported under a specific counter. To get more information on the makeup of this or the other categories, take a snapshot in the Detailed view or with the Memory Profiler package. Important: The Other category doesn’t directly map to the Other group in the Detailed view. In this view, Other contains the remainder of the native memory that was not used for the GPU side of graphics memory, the Profiler, Audio, or Video memory. |
該当なし | 該当なし |
| Profiler | The memory that the Profiler functionality uses and reserves from the system. | Profiler Used Memory Profiler Reserved Memory |
あり |
| Objects stats | Displays the amount of object instances of the types of Assets that commonly take up a high percentage of the memory (Textures, Meshes, Materials, Animation Clips), together with their accumulated sizes in memory (Assets, GameObjects, Scene Objects). Note: Texture and Mesh memory doesn’t map directly to the Graphics & Graphics Driver stat in the Total Memory Breakdown view. This is because some of that memory might also fall into the Other category of the Total Memory Breakdown bar. |
Object Count | なし |
| テクスチャ | ロードされたテクスチャの総数と、それらが使用するメモリ量。 | Texture Count Texture Memory |
なし |
| メッシュ | ロードされたメッシュの総数と使用するメモリ量。 | Mesh Count Mesh Memory |
なし |
| マテリアル | ロードされたメッシュの総数と使用するメモリ量。 | Material Count Material Memory |
なし |
| アニメーションクリップ | ロードされたアニメーションクリップの総数と使用するメモリ量。 | AnimationClip Count AnimationClip Memory |
なし |
| Assets | ロードされたアセット総数。 | Asset Count | なし |
| Game Objects | The total number of GameObject instances in the scene. | GameObject Count | なし |
| シーンオブジェクト | The total number of dynamic UnityEngine.Objects. This number includes the GameObject Count, plus the total number of components, and everything which isn’t an asset in the scene. |
Scene Object Count | なし |
| GC allocated in frame | Displays the amount of managed allocations in the selected frame, and their total size in bytes. | GC Allocation In Frame Count GC Allocated In Frame |
なし |
プレイヤーの可用性
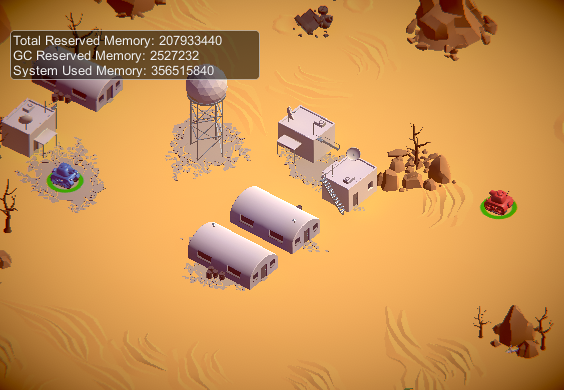
You can use the ProfilerRecorder API to access the Memory Profiler module’s counters in Players. The following example contains a simple script that collects Total Reserved Memory, GC Reserved Memory and System Used Memory metrics, and displays those as a GUI.TextArea. The Memory Profiler module information belongs to the ProfilerCategory.Memory Profiler category.
using System.Text;
using Unity.Profiling;
using UnityEngine;

public class MemoryStatsScript : MonoBehaviour
{
    string statsText;
    ProfilerRecorder totalReservedMemoryRecorder;
    ProfilerRecorder gcReservedMemoryRecorder;
    ProfilerRecorder systemUsedMemoryRecorder;

    void OnEnable()
    {
        totalReservedMemoryRecorder = ProfilerRecorder.StartNew(ProfilerCategory.Memory, "Total Reserved Memory");
        gcReservedMemoryRecorder = ProfilerRecorder.StartNew(ProfilerCategory.Memory, "GC Reserved Memory");
        systemUsedMemoryRecorder = ProfilerRecorder.StartNew(ProfilerCategory.Memory, "System Used Memory");
    }

    void OnDisable()
    {
        totalReservedMemoryRecorder.Dispose();
        gcReservedMemoryRecorder.Dispose();
        systemUsedMemoryRecorder.Dispose();
    }

    void Update()
    {
        var sb = new StringBuilder(500);
        if (totalReservedMemoryRecorder.Valid)
            sb.AppendLine($"Total Reserved Memory: {totalReservedMemoryRecorder.LastValue}");
        if (gcReservedMemoryRecorder.Valid)
            sb.AppendLine($"GC Reserved Memory: {gcReservedMemoryRecorder.LastValue}");
        if (systemUsedMemoryRecorder.Valid)
            sb.AppendLine($"System Used Memory: {systemUsedMemoryRecorder.LastValue}");
        statsText = sb.ToString();
    }

    void OnGUI()
    {
        GUI.TextArea(new Rect(10, 30, 250, 50), statsText);
    }
}
以下のスクリーンショットは、Tanks! tutorial project にスクリプトを追加した結果を表しています。
This information is available in Release Players, as are the other high level counters in the table above. If you want to see the selected memory counters in a custom module in the Profiler window, use the Module Editor to configure the chart.
詳細ビュー
The Detailed view provides a snapshot of your application’s current state. Select the Take Sample button to capture detailed memory usage for the current target. It takes the Profiler time to get this data, so the Detailed view doesn’t give you real-time details. After the Profiler takes a sample, the Profiler window displays a list view where you can explore your application’s memory usage in more detail.
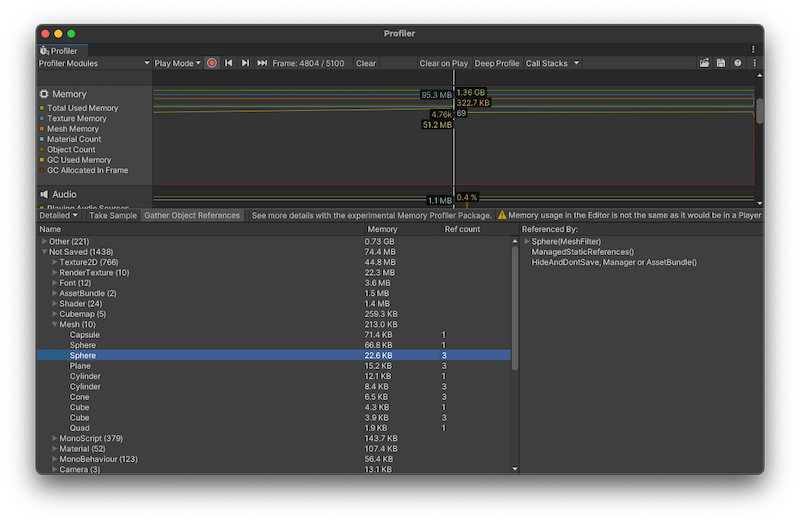
Enable the Gather Object References setting at the top of the module details pane to collect information about what’s referencing an object at the time of the snapshot. The Profiler displays this information in the right-hand pane of the window.
リストビューでは、メモリを使用するオブジェクトを以下のカテゴリに分類しています。
- Other: アセット、ゲームオブジェクト、コンポーネントのいずれでもないオブジェクト。Unity が異なるシステムで使用するメモリなどの情報が含まれます。
- Not Saved: Objects marked as DontSave
- Builtin Resources: Unity Editor resources or Unity default resources, such as Shaders you have added to the Always Included Shaders list of the Graphics settings.
- Assets: ユーザーやネイティブコードから参照されるアセット
- Scene Memory: Objects and attached components.
When you click on a GameObject in the Assets or Scene Memory list, Unity highlights it in the Project or Scene view.
Note: In the Other category, memory reported under System.ExecutableAndDlls is read-only memory. The operating system might discard these pages as needed and later reload them from the file system. This generates lower memory usage, and doesn’t directly contribute to the operating system’s decision to close your application if it uses too much memory. Some of these pages might also be shared with other applications that are using the same frameworks.
Copyright © 2023 Unity Technologies
优美缔软件(上海)有限公司 版权所有
"Unity"、Unity 徽标及其他 Unity 商标是 Unity Technologies 或其附属机构在美国及其他地区的商标或注册商标。其他名称或品牌是其各自所有者的商标。
公安部备案号:
31010902002961