Memory プロファイラーモジュール
The Memory module visualizes counters that represent the total allocated memory in your application. You can use the memory module to see information such as the number of loaded objects and the memory that they take in total per category. You can also see the number of GC allocations per Profiler frame.
Using the memory module when profiling in the Editor
When you profile your application in the Editor, all of the numbers the Memory module displays indicates the memory usage in the Editor, and not the application’s release platform. These numbers are generally larger than when running on the release platform, because running the Unity Editor uses specific objects that take up memory, and the Editor window uses extra memory. Additionally, the memory that the Profiler itself uses is displayed, since Unity cannot cleanly separate it from the memory that the Play mode Player uses.
For more precise numbers and memory usage for your application, connect the Profiler to the running player via the Attach to Player menu. This returns the actual usage on the target device.
チャートのカテゴリ
The Memory module is divided into six charts that display detailed information on where memory is spent in your application. You can change the order of the categories in the chart by dragging and dropping them in the chart’s legend. You can also click a category’s colored legend to toggle its display.
| カテゴリ | 説明 |
|---|---|
| Total Allocated | アプリケーションが使用する合計メモリ |
| Texture Memory | アプリケーションの テクスチャ が使用するメモリ量 |
| Mesh Memory | アプリケーションの メッシュ が使用するメモリ量 |
| Material Count | アプリケーションの マテリアル のインスタンス数 |
| Object Count | アプリケーションのネイティブのオブジェクトのインスタンス数 |
| Total GC Allocated | GC ヒープによって使用されるメモリ量 |
| GC Allocated | GC ヒープのフレームごとに割り当てられたメモリ量 |
モジュールの詳細ペイン
モジュールの詳細ペインには、Profiler ウィンドウの下部にある Simple と Detail の 2 つの表示があります。表示を変更するには、モジュール詳細ペインの左上のドロップダウンから表示を選択します。
Simple ビュー
Simple ビューは、Unity 全体でメモリがどのように使用されているかの概要をフレームごとにリアルタイムで表示します。
Unity reserves memory pools for allocations to avoid asking the operating system for memory too often. This is displayed as a reserved amount, and how much is used.
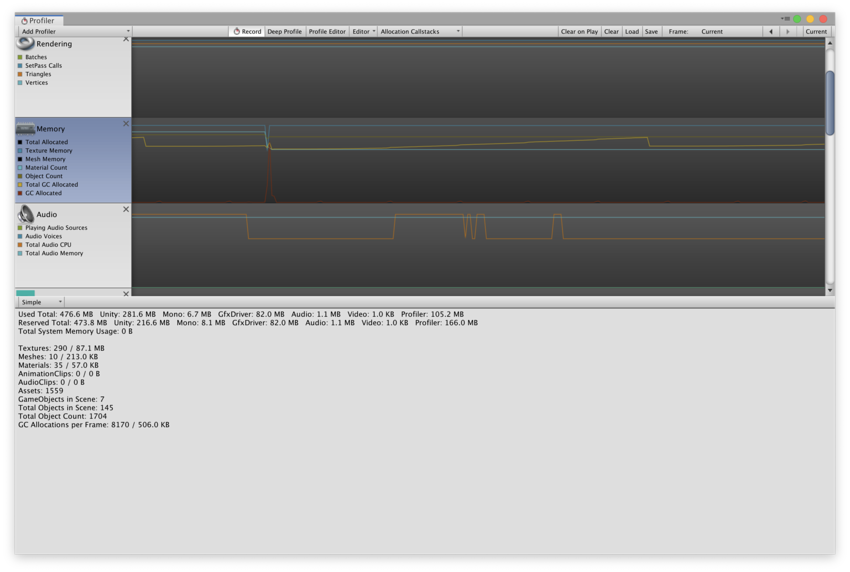
このエリアには以下が含まれています。
- Total: 以下のすべてのエリアの累積値
- Unity: ネイティブの Unity コードのメモリ割り当て量。ネイティブのメモリ管理システムによって追跡され、そのタイプ、ソース、プラットフォーム固有の割り当てパターンによってメモリプールに割り当てられます。
- Mono: 全体のヒープサイズとマネージドコードが使用するヒープサイズ。このメモリはガベージコレクションされます。
- GfxDriver: ドライバーがテクスチャ、レンダーターゲット、シェーダー、メッシュデータに使用している推定メモリ量
- Audio: オーディオシステムの推定メモリ使用量
- Video: ビデオシステムの推定メモリ使用量
- Profiler: プロファイラーが使用する総メモリ
The numbers that are displayed are different to those displayed the Task Manager or Activity Monitor. This is because some usage is untracked by the Memory Profiler. This includes memory some drivers or plug-ins use, and memory used for executable code. On platforms that support getting the total memory size of the application from the OS, the Total System Memory Usage is over 0 and is the same size in a Task Manager or Activity Monitor.
Underneath the overview of where the memory is spent, are memory statistics for some of the most common Asset and object types. These statistics include the count (before the slash) and the used memory.
In this list, the Object Count displays the total number of native objects that your application creates. If this number rises over time, your application is creating objects that are never destroyed.
Detailed ビュー
You can use the Detailed view to take a snapshot of your application’s current state. Click the Take Sample button to capture detailed memory usage for the current target. It takes the Profiler a lot of time to obtaining this data, so the Detailed view does not give you real-time details. After the Profiler takes a sample, the Profiler window displays a tree view where you can explore your application’s memory usage in more detail.
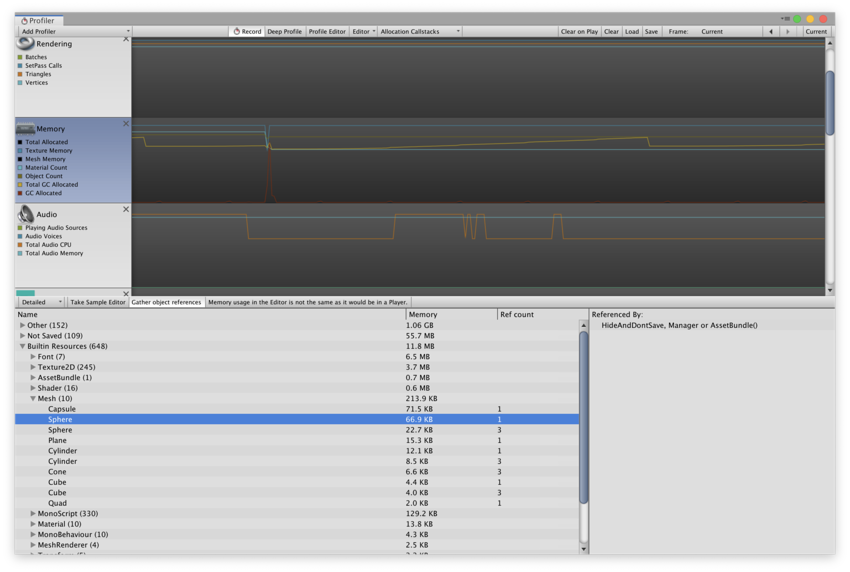
モジュールの詳細ペインの上部にある Gather object references 設定を有効にして、スナップショットの時点でオブジェクトを参照しているものに関する情報を収集できます。この情報は、ウィンドウの右側のペインに表示されます。
メモリを使用するオブジェクトは、ツリービューで以下のカテゴリに分類されます。
- Other: アセット、ゲームオブジェクト、コンポーネントのいずれでもないオブジェクト。Unity が異なるシステムで使用するメモリなどの情報はこちらを参照してください。
- Not Saved: DontSave とマークされたオブジェクト
- Builtin Resources: Unity エディターリソース、または Unity のデフォルトリソース。例えば、Graphics 設定の Always Included Shaders リストに加えたシェーダーなど。
- Assets: ユーザーやネイティブコードから参照されるアセット
- Scene Memory: ゲームオブジェクトとアタッチされたコンポーネント
Asset または Scene Memory リストでオブジェクトをクリックすると、Project またはシーンビューでハイライトされます。
Note: In the Other category, memory reported under System.ExecutableAndDlls is read-only memory. The operating system might discard these pages as needed and later reload them from the file system. This generates lower memory usage, and usually does not directly contribute to the operating system’s decision to kill your application if it uses too much memory. Some of these pages might also be shared with other applications that are using the same frameworks.
Memory Profiler package
In addition to the Memory module, you can use the Memory Profiler package to analyze memory usage in your application in even more detail. You can store and compare snapshots to find memory leaks more easily, or see the memory layout to find memory fragmentation issues. For information on the Memory Profiler package, see the Memory Profiler documentation.
Copyright © 2023 Unity Technologies
优美缔软件(上海)有限公司 版权所有
"Unity"、Unity 徽标及其他 Unity 商标是 Unity Technologies 或其附属机构在美国及其他地区的商标或注册商标。其他名称或品牌是其各自所有者的商标。
公安部备案号:
31010902002961