Memory Profiler 模块
The Memory module visualizes counters that represent the total allocated memory in your application. You can use the memory module to see information such as the number of loaded objects and the memory that they take in total per category. You can also see the number of GC allocations per Profiler frame.
Using the memory module when profiling in the Editor
When you profile your application in the Editor, all of the numbers the Memory module displays indicates the memory usage in the Editor, and not the application’s release platform. These numbers are generally larger than when running on the release platform, because running the Unity Editor uses specific objects that take up memory, and the Editor window uses extra memory. Additionally, the memory that the Profiler itself uses is displayed, since Unity cannot cleanly separate it from the memory that the Play mode Player uses.
For more precise numbers and memory usage for your application, connect the Profiler to the running player via the Attach to Player menu. This returns the actual usage on the target device.
图表类别
The Memory module is divided into six charts that display detailed information on where memory is spent in your application. You can change the order of the categories in the chart by dragging and dropping them in the chart’s legend. You can also click a category’s colored legend to toggle its display.
| 类别 | 描述 |
|---|---|
| Total Allocated | 应用程序已使用的内存总量 |
| Texture Memory | 应用程序中的纹理已使用的内存量 |
| Mesh Memory | 应用程序中的网格已使用的内存量 |
| Material Count | 应用程序中的材质实例数量 |
| Object Count | 应用程序中的原生对象实例数量 |
| Total GC Allocated | GC 堆使用的内存量。 |
| GC Allocated | GC 堆中每帧分配的内存量 |
模块详细信息面板
位于 Profiler 窗口底部的模块详细信息面板中有两个视图:__Simple__ 和 Detailed。要更改视图,请从模块详细信息面板左上角的下拉列表中选择相应的视图。
Simple 视图
Simple 视图显示每个帧在整个 Unity 中的实时内存使用量的概况。
Unity reserves memory pools for allocations to avoid asking the operating system for memory too often. This is displayed as a reserved amount, and how much is used.
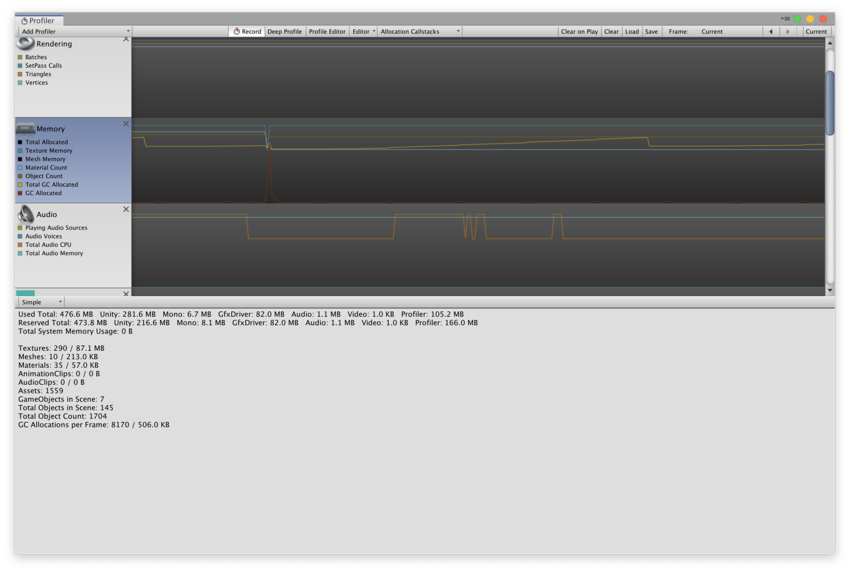
此部分涵盖的方面包括:
- Total:以下所有区域的累计值
- Unity:Unity 原生代码中由原生内存管理器系统跟踪并根据类型、来源和平台特有的分配模式在内存池中分配的内存分配量。
- Mono:托管代码使用的总堆大小和已用堆大小。此内存量是垃圾收集量。
- GfxDriver:驱动程序对纹理、渲染目标、着色器和网格数据使用的估计内存量。
- Audio:音频系统的估计内存使用量
- Video:视频系统的估计内存使用量
- Profiler:性能分析器使用的总内存
The numbers that are displayed are different to those displayed the Task Manager or Activity Monitor. This is because some usage is untracked by the Memory Profiler. This includes memory some drivers or plug-ins use, and memory used for executable code. On platforms that support getting the total memory size of the application from the OS, the Total System Memory Usage is over 0 and is the same size in a Task Manager or Activity Monitor.
Underneath the overview of where the memory is spent, are memory statistics for some of the most common Asset and object types. These statistics include the count (before the slash) and the used memory.
In this list, the Object Count displays the total number of native objects that your application creates. If this number rises over time, your application is creating objects that are never destroyed.
Detailed 视图
You can use the Detailed view to take a snapshot of your application’s current state. Click the Take Sample button to capture detailed memory usage for the current target. It takes the Profiler a lot of time to obtaining this data, so the Detailed view does not give you real-time details. After the Profiler takes a sample, the Profiler window displays a tree view where you can explore your application’s memory usage in more detail.
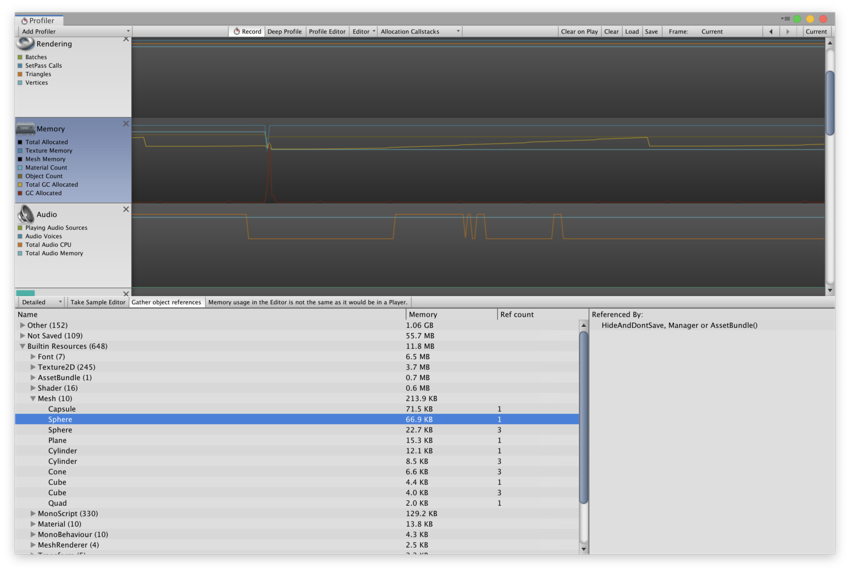
启用模块详细信息面板顶部的 Gather object references 设置可以收集有关生成快照时哪些项可能引用了对象的信息。此信息显示在窗口的右侧面板中。
在树视图中,使用内存的对象将分为以下类别:
- Other:资源、游戏对象或组件以外的对象。在此处可以找到诸如 Unity 用于不同系统的内存之类的信息。
- Not Saved:标记为 DontSave 的对象
- Builtin Resources:Unity Editor 资源或 Unity 默认资源,例如已添加到 Graphics 设置的 Always Included Shaders 列表中的着色器。
- Assets:从用户或原生代码引用的资源
- Scene Memory:对象和附加的组件
单击 Assets 或 Scene Memory 列表中的对象时,该对象会在 Project 视图或 Scene 视图中突出显示。
Note: In the Other category, memory reported under System.ExecutableAndDlls is read-only memory. The operating system might discard these pages as needed and later reload them from the file system. This generates lower memory usage, and usually does not directly contribute to the operating system’s decision to kill your application if it uses too much memory. Some of these pages might also be shared with other applications that are using the same frameworks.
Memory Profiler package
In addition to the Memory module, you can use the Memory Profiler package to analyze memory usage in your application in even more detail. You can store and compare snapshots to find memory leaks more easily, or see the memory layout to find memory fragmentation issues. For information on the Memory Profiler package, see the Memory Profiler documentation.
Copyright © 2023 Unity Technologies
优美缔软件(上海)有限公司 版权所有
"Unity"、Unity 徽标及其他 Unity 商标是 Unity Technologies 或其附属机构在美国及其他地区的商标或注册商标。其他名称或品牌是其各自所有者的商标。
公安部备案号:
31010902002961