Memory Profiler 模块
有两种方法可以在 Unity 中分析应用程序的内存使用情况:
- Memory Profiler 模块:这是内置性能分析器模块,可提供有关应用程序内存使用情况的基本信息。
- Memory Profiler 包:这是可以添加到项目中的一个单独的包。这个包会向 Unity Editor 添加一个额外的 Memory Profiler 窗口,然后您可以使用该窗口来更详细地分析应用程序中的内存使用情况。可以存储和比较快照以便更轻松地查出内存泄漏,或者查看内存布局以查出内存碎片问题。
本页涵盖有关内置 Memory Profiler 模块的信息。有关 Memory Profiler 包的更多信息,请参阅 Memory Profiler 文档。
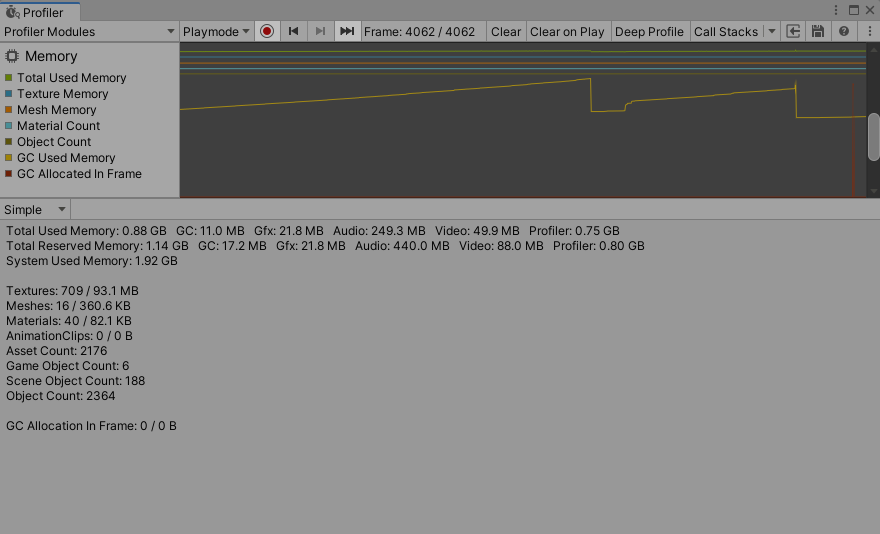
Memory Profiler 模块中会显示一些代表应用程序中分配的总内存的计数器。可以使用 Memory 模块来查看信息,例如已加载对象的数量以及每个类别占用的总内存。还可以查看每个性能分析器帧的 GC 分配数。
在编辑器中对应用程序进行性能分析时,Memory 模块中的信息指示编辑器中的内存使用量。这些数字通常大于在发布平台上运行时的数字,因为运行 Unity Editor 会使用占用内存的特定对象,而 Editor 窗口本身会使用额外的内存。此外,该性能分析器显示它使用的内存,因为 Unity 无法将其与运行模式的播放器所使用的内存完全分开。 要获得更精确的数值和应用程序内存使用情况,请通过 Attach to Player 菜单将性能分析器连接到正在运行的播放器。这样就可以查看目标设备上的实际使用情况。
图表类别
Memory 模块分为六个图表,这些图表显示有关应用程序在哪些方面花费了内存的详细信息。可以更改图表中类别的顺序;为此,请在图表的图例中拖放这些类别。还可以单击某个类别的有色图例以切换是否显示。
| 类别 | 描述 |
|---|---|
| Total Allocated | 应用程序已使用的内存总量。 |
| Texture Memory | 应用程序中的纹理已使用的内存量。 |
| Mesh Memory | 应用程序中的网格已使用的内存量。 |
| Material Count | 应用程序中的材质实例数量。 |
| Object Count | 应用程序中的原生对象实例数量。 |
| GC Used Memory | GC 堆使用的内存量。 |
| GC Allocated in Frame | GC 堆中每帧分配的内存量。 |
模块详细信息面板
位于 Profiler 窗口底部的模块详细信息面板中有两个视图:Simple 和 Detailed。要更改视图,请从模块详细信息面板左上角的下拉列表中选择相应的视图。
Simple 视图
Simple 视图显示每个帧在 Unity 实时内存使用量的概况。
Unity 保留了可供分配的内存池,从而避免过于频繁向操作系统索取内存。性能分析器显示保留了多少内存,以及 Unity 使用了多少。
此信息也可通过 ProfilerRecorder API 及 Profiler Module Editor 获得,因此您可以将它们添加到自定义性能分析器模块中。
| 统计信息 | 描述 | 在发行版播放器中可用 |
|---|---|---|
| Total Used Memory | Unity 使用和跟踪的总内存数量。 | 是 |
| Total Reserved Memory | Unity 用于跟踪目的和池分配的总保留内存。 | 是 |
|
GC Used Memory GC Reserved Memory |
托管代码使用的已用堆大小和总堆大小。此内存量是垃圾收集量。 | 是 |
|
Gfx Used Memory Gfx Reserved Memory |
驱动程序对纹理、渲染目标、着色器和网格数据使用的估计内存量。 | 否 |
|
Audio Used Memory Audio Reserved Memory |
音频系统的估计内存使用量。 | 是 |
|
Video Used Memory Video Reserved Memory |
视频系统的估计内存使用量 | 是 |
|
Profiler Used Memory Profiler Reserved Memory |
性能分析器功能使用并从系统中保留的内存。 | 是 |
| System Used Memory | 性能分析器中的值与操作系统任务管理器中显示的值不同,因为 Memory Profiler 不会跟踪系统中的所有内存使用情况。这包括某些驱动程序和插件使用的内存,以及用于可执行代码的内存。 在支持从操作系统获取应用程序总内存大小的平台上,System Memory Usage 大于 0 并且与任务管理器中的大小相同。 |
是 |
|
Texture Count Texture Memory |
已加载的纹理总数及其使用的内存。 | 否 |
|
Mesh Count Mesh Memory |
已加载的网格总数及其使用的内存。 | 否 |
|
Material Count Material Memory |
已加载的材质总数及其使用的内存。 | 否 |
|
AnimationClip Count AnimationClip Memory |
已加载的动画剪辑总数及其使用的内存。 | 否 |
| Asset Count | 已加载的资源总数。 | 否 |
| GameObject Count | 场景中游戏对象的总数。 | 否 |
| Scene Object Count | 动态 UnityEngine.Object 的总数。此数值包括 GameObject Count,加上组件的总数,以及场景中所有非资源内容的数量。 |
否 |
| Object Count | 本机 UnityEngine.Object 总数是您的应用程序创建或加载的数量。此数值包括 Scene Object Count,加上所有资源的总数。如果此数值随时间推移而上升,表示应用程序创建了一些永不销毁或上载的游戏对象或其他资源。 |
否 |
|
GC Allocation In Frame Count GC Allocated In Frame |
托管分配的数量及其总大小(以字节为单位)。 | 否 |
播放器中的可用性
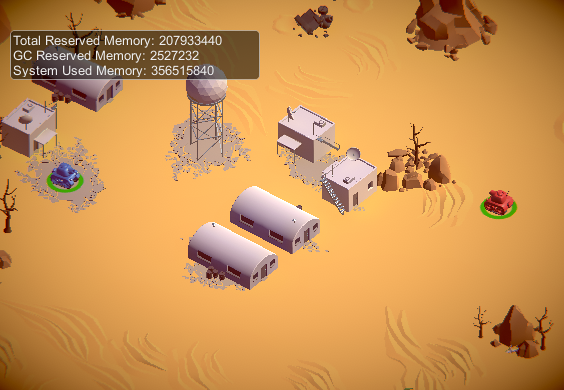
You can use the ProfilerRecorder API to access the Memory Profiler module’s counters in Players. The following example contains a simple script that collects “Total Reserved Memory”, “GC Reserved Memory” and “System Used Memory” metrics, and displays those as a GUI.TextArea. The Memory Profiler module information belongs to the ProfilerCategory.Memory Profiler category.
using System.Text;
using Unity.Profiling;
using UnityEngine;

public class MemoryStatsScript : MonoBehaviour
{
    string statsText;
    ProfilerRecorder totalReservedMemoryRecorder;
    ProfilerRecorder gcReservedMemoryRecorder;
    ProfilerRecorder systemUsedMemoryRecorder;

    void OnEnable()
    {
        totalReservedMemoryRecorder = ProfilerRecorder.StartNew(ProfilerCategory.Memory, "Total Reserved Memory");
        gcReservedMemoryRecorder = ProfilerRecorder.StartNew(ProfilerCategory.Memory, "GC Reserved Memory");
        systemUsedMemoryRecorder = ProfilerRecorder.StartNew(ProfilerCategory.Memory, "System Used Memory");
    }

    void OnDisable()
    {
        totalReservedMemoryRecorder.Dispose();
        gcReservedMemoryRecorder.Dispose();
        systemUsedMemoryRecorder.Dispose();
    }

    void Update()
    {
        var sb = new StringBuilder(500);
        if (totalReservedMemoryRecorder.Valid)
            sb.AppendLine($"Total Reserved Memory: {totalReservedMemoryRecorder.LastValue}");
        if (gcReservedMemoryRecorder.Valid)
            sb.AppendLine($"GC Reserved Memory: {gcReservedMemoryRecorder.LastValue}");
        if (systemUsedMemoryRecorder.Valid)
            sb.AppendLine($"System Used Memory: {systemUsedMemoryRecorder.LastValue}");
        statsText = sb.ToString();
    }

    void OnGUI()
    {
        GUI.TextArea(new Rect(10, 30, 250, 50), statsText);
    }
}
以下屏幕截图显示了将脚本添加到 Tanks! 教程项目的结果。
此信息在发行版播放器中可用,上表中的其他高级计数器也可用。如果要在 Profiler 窗口的自定义模块中查看选定的内存计数器,请使用模块编辑器配置图表。
Detailed 视图
Detailed 视图提供了应用程序当前状态的快照。单击 Take Sample 按钮可捕获当前目标的详细内存使用情况。性能分析器获取此数据需要时间,因此 Detailed 视图不会提供实时详细信息。在性能分析器获取样本之后,Profiler 窗口会显示一个列表视图,您可以在其中更详细地浏览应用程序的内存使用情况。
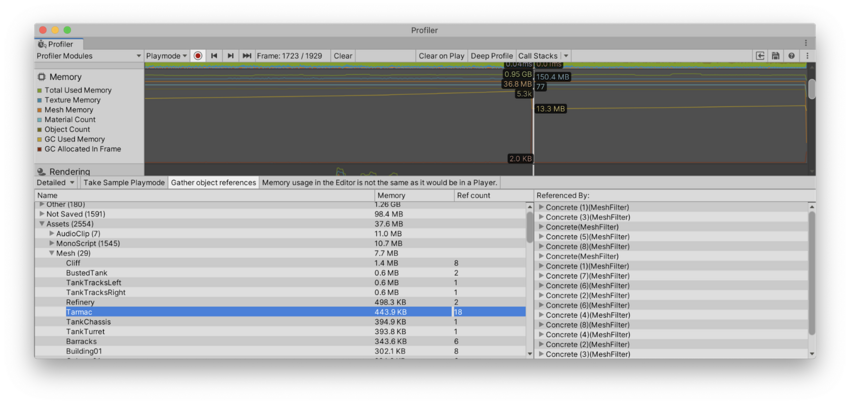
启用模块详细信息面板顶部的 Gather object references 设置可以收集有关生成快照时哪些项可能引用了对象的信息。性能分析器将此信息显示在窗口的右侧面板中。
列表视图将使用内存的对象将分为以下类别:
- Other:资源、游戏对象或组件以外的对象。其中包括诸如 Unity 用于不同系统的内存之类的信息。
- Not Saved:标记为 DontSave 的对象
- Builtin Resources:Unity 编辑器资源或 Unity 默认资源,例如已添加到 Graphics 设置的 Always Included Shaders 列表中的着色器。
- Assets:从用户或原生代码引用的资源。
- Scene Memory:对象和附加的组件。
单击 Assets 或 Scene Memory 列表中的游戏对象时,该对象会在 Project 视图或 Scene 视图中突出显示。
注意:在 Other 类别中, System.ExecutableAndDlls 下报告的内存为只读内存。操作系统可能会根据需要丢弃这些页面,然后从文件系统重新加载这些页面。这样可以降低内存使用量,而且通常不会直接导致操作系统决定关闭应用程序(如果应用程序使用过多内存)。此外,其中一些页面也可能与使用相同框架的其他应用程序共享。
Copyright © 2023 Unity Technologies
优美缔软件(上海)有限公司 版权所有
"Unity"、Unity 徽标及其他 Unity 商标是 Unity Technologies 或其附属机构在美国及其他地区的商标或注册商标。其他名称或品牌是其各自所有者的商标。
公安部备案号:
31010902002961