Xcode Frame Debugger integration
The Unity Editor integrates with the Xcode frame debugger for detailed frame inspection and debugging.
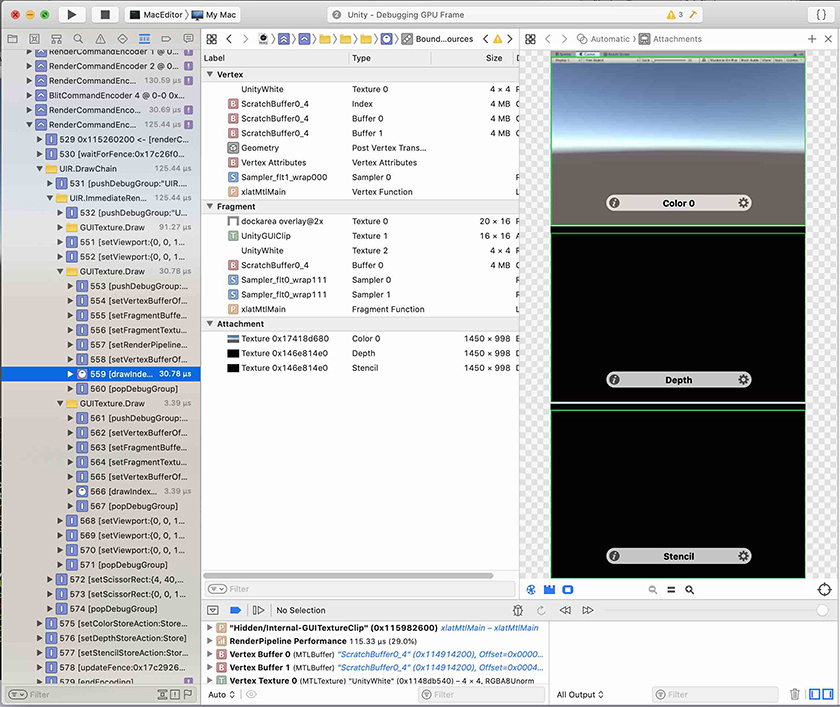
You can use the Xcode frame debugger to capture a frame of a complex scene in your application, then identify bottlenecks in your shaders. On devices with the A11 chip or later (iPhone 8 and newer devices), Xcode offers an even more detailed breakdown of shader timing. This allows you to analyze performance and debug vertex and fragment issues.
Note: Frame capture with Xcode and Unity only works if Unity is running on a platform and graphics API that Xcode supports. As of Unity 2019.2, Xcode supports only macOS with Metal graphics. If Unity uses another API, the Xcode integration is disabled until you select a supported graphics API.
Loading the Xcode frame debugger
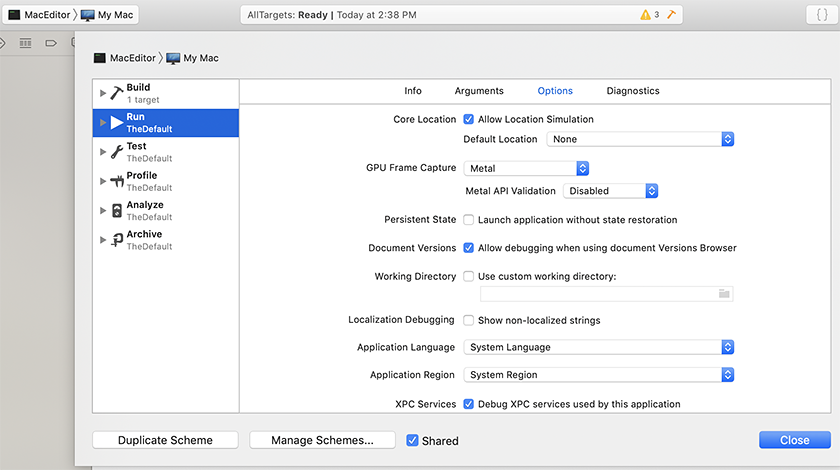
To load the Xcode frame debugger, launch the Unity Editor through Xcode, with Metal selected as the GPU Frame Capture option.
Capturing a frame with Xcode
When you launch the Editor from Xcode, a new button appears on the right side of the toolbar in the Game and Scene views.
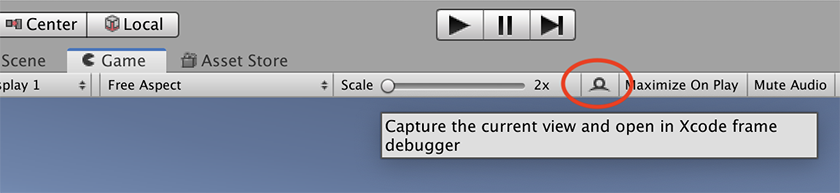
Select the Xcode Capture button to trigger a capture of the next frame of rendering for the view. If Xcode isn’t open, when you select this button, Xcode launches a new instance to show the capture. Otherwise, the newest capture automatically appears in the Xcode frame debugger window. From there, you can open the capture and analyze it.
Copyright © 2023 Unity Technologies
优美缔软件(上海)有限公司 版权所有
"Unity"、Unity 徽标及其他 Unity 商标是 Unity Technologies 或其附属机构在美国及其他地区的商标或注册商标。其他名称或品牌是其各自所有者的商标。
公安部备案号:
31010902002961