CPU Usage Profiler module
The CPU Usage Profiler module’s chart displays where time is spent in your application. It contains an overview of all the important areas where your application spends time, such as on rendering, its scripts, and animation. This section of the documentation covers:
- CPU Usage charts
- CPU Usage module details pane
- Timeline view
- Hierarchy and Raw Hierarchy view
- Performance warnings
- Allocation Callstacks
- Editor only samples
Chart categories
The CPU Usage Profiler module’s chart tracks the time spent on the application’s main thread. The timings are divided into nine categories,. You can change the order of the categories in the chart by dragging and dropping them in the chart’s legend. You can also click a category’s colored legend to toggle its display.
| Category | Description |
|---|---|
| Визуализация | How much time your application spends on rendering graphics. |
| Scripts | How much time your application spends on running scripts. |
| Physics | How much time your application spends on the physics engine. |
| Animation | How much time your application spends on animating SkinnedMeshRenderers, GameObjects and other components in your application. This also includes the time spent on some calculations for systems the Animation and Animator components utilize. |
| GarbageCollector | How much time your application spends on running the Garbage Collector. |
| VSync | How much time is spent in a frame waiting for the targetFrameRate or the next VBlank to sync with. This is according to the QualitySettings.vSyncCount value, or the target framerate, or the VSync setting that is the default or enforced maximum of the platform your application is running on. For more information about VSync, see the section in this documentation on Rendering and VSync samples. |
| Global Illumination | How much time is spent on lighting in your application. |
| UI | How much time is spent on displaying your application’s UI. |
| Others | How much time is spent in code that does not fall in any of the other categories, for instance the entire EditorLoop, or the Profiling overhead when profiling Playmode in the Editor. |
Module details pane
When you select the CPU Usage module, the module details pane displays a breakdown of where time was spent in the selected frame. The timing data is either displayed as a timeline or a hierarchical table, which you can change by clicking on the top left dropdown in the module details pane. The three views available are:
| View | Функция: |
|---|---|
| Timeline | Displays a breakdown of the timings for a particular frame alongside a time axis of the frame’s length. This is the only view mode that you can use to see timings on threads other than the main thread, and correlate timings across threads, for instance Job System worker threads spinning up after a system on the main thread schedules them. |
| Hierarchy | Groups the timing data by its hierarchical structure. This option displays the elements that your application called in a descending list format, ordered by the time spent (default), the amount of scripting memory allocated (GC.Alloc) or the number of calls. To change the column that orders the table, click on the table column’s header. |
| Raw Hierarchy | Displays the timing data in a hierarchical structure that is similar to the call stacks where the timing occurred. Unity lists each call stack separately in this mode instead of merging them, as it does in Hierarchy view. |
Timeline view
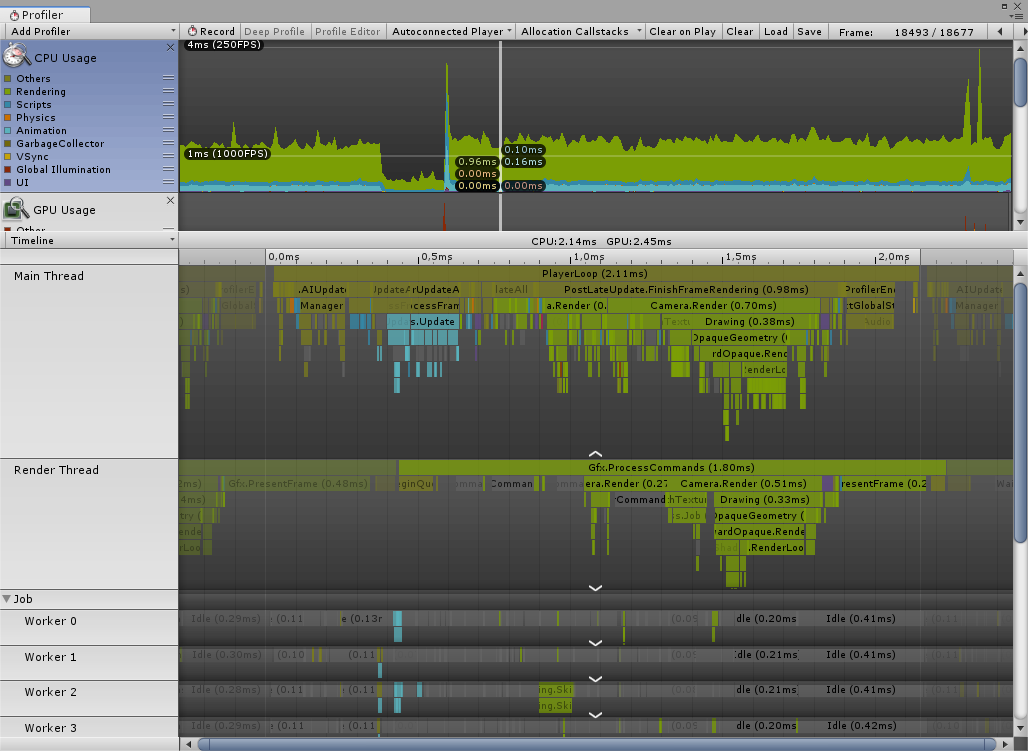
The Timeline view is the default view for the CPU Usage Profiler module. It contains an overview of where time is spent in your application and how the timings relate to each other. The Timeline view displays profiling data from all threads in their own own subsections and along the same time axis. This is unlike the Hierarchy views, which only show profiling data from the main thread.
You can use the Timeline view to see how activities on the different threads correlate to each other in their parallel execution. You can see how much or little you are utilizing the different threads, such as the Job System’s worker threads, how work on the threads are queued up, and if any thread is idling (“Idle” sample) or waiting for another thread or a Job to finish (“Wait for x” sample).
In the screenshot above, there are light blue animation samples in the worker threads of the Job System while the main thread also processes animation data. The rendering work is split between the Main Thread and the Render Thread. The Render Thread does not align with the Main Thread. During the first ~0.4 ms of this particular frame, the Render Thread was still rendering the last frame. Similarly, this frame takes up the first ~0.1ms of the next frame. Bars that belong to other frames are greyed out, and the vertical lines on the time ruler at the top of the modules detail pane mark the beginning and the end of the frame on the main thread.
When you profile the GPU Usage, the toolbar above the time ruler shows how much of the frame time was spent on the CPU and how much on the GPU. In this example, the game is GPU bound and spends the biggest amount of time on the CPU for rendering, so this application needs its graphics performance optimized.
Navigating and selecting items
To zoom in on areas of the time axis, use the scroll wheel on your mouse, or press and hold the Alt key while you drag with the right mouse button pressed down. You can also use the ends of the horizontal scrollbar to zoom in. Press the A key on your keyboard to reset the zoom so that the entire frame time is visible.
Whenever you see a white arrow on the bottom of a thread, you can click it to unfold the thread to show all lines or click again to show only the top ones. You can also drag the line that separates the threads to readjust how many lines you can see. Double-clicking the line sets the height of the thread’s section to the maximum depth of the call stack. To pan the view, press the middle mouse button or hold the Alt key (Command key on macOS) and press the left mouse button.
To collapse and expand groups of threads, click on the foldout arrows next to the thread names on the far left of the view.
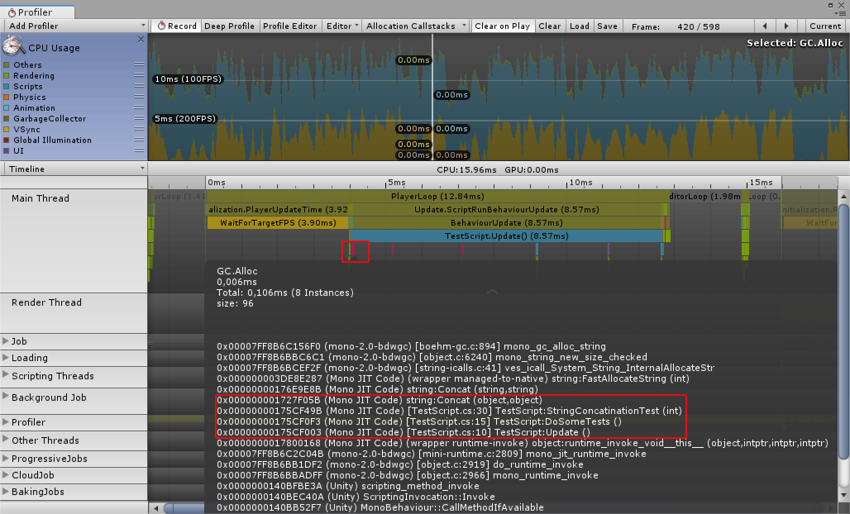
To see an item’s contribution to the CPU chart, select it in the lower pane by clicking on it, and the Profiler highlights its contribution, and dims the rest of the chart. To deselect the item, click elsewhere in the view. Press the F key to focus the current sample you selected or show the default zoom level if you’ve selected nothing.

In the above example, the tooltip on the selected item provides further details such as the number of instances and the total time of this sample across all threads. GC.Alloc samples show up colored in red-magenta and show you the size of the Allocation.
To show Managed Callstacks in the tooltip, enable the Managed Callstacks option from the Allocation Callstacks dropdown in the Profiler window’s toolbar. You need to enable the Managed Callstacks setting before profiling a frame to show it for that frame. This option only works when you are profiling in the Editor. For more information, see the section on Allocation Callstacks.
You can also manually measure any arbitrary time span in the Timeline view by clicking and dragging horizontally anywhere to display an overlay across a section of the timeline. You can see the time encompassed by that overlay in the time ruler at the top. Press the F key while the overlay is displayed to frame the view horizontally along the selected time section. Click anywhere to remove the overlay.
Hierarchy and Raw Hierarchy view
When you switch to the Hierarchy or Raw Hierarchy view, your selection carries over, as long as the sample is on the main thread. If you cannot immediately find your selection, press the F key to focus it.

The Hierarchy view lists all samples that have been profiled and groups them together by their shared call stack and the hierarchy of ProfilerMarkers. The Raw Hierarchy view does not group samples together, which makes it ideal for looking into samples on a granular level. Both display the following detailed information for each step in the hierarchy next to each row:
| Property | Функция: |
|---|---|
| Total | The total amount of time spent on a particular function as a percentage. |
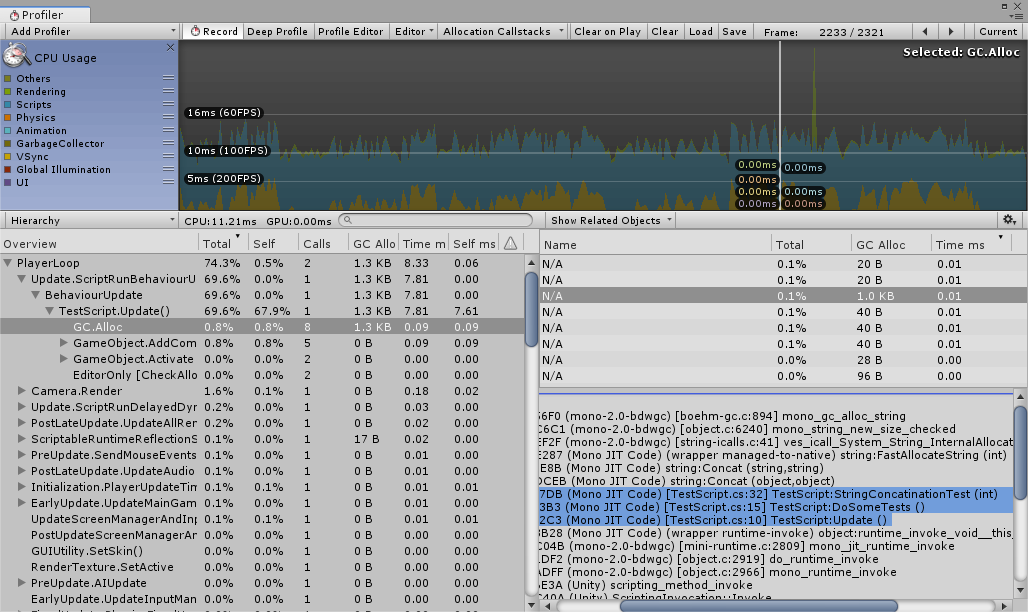
| Self | The total amount of time spent on a particular function as a percentage, excluding the time Unity spends calling sub-functions. For example, in the screenshot, 41.7% of time is spent in the Camera.Render function. This is because it calls a lot of drawing and culling functions, however when you exclude the functions it calls, only 3.5% of time is spent on the Camera.Render function itself. |
| Calls | The number of calls made to this function in this frame. In the Raw Hierarchy view the values in this column are always 1 because the Profiler does not merge the hierarchy of samples. |
| GC Alloc | How much scripting heap memory Unity has allocated in the current frame. The scripting heap memory is managed by the garbage collector. Whenever a GC.Collect() is called or there is a scripting heap allocation that does not fit within the heap’s current size, the garbage collector is triggered. It marks all allocations that have no more references to them and collects them. This process shows up as GC.Collect samples in the Profiler. Unity runs the garbage collector more frequently as you allocate more on the heap. As the managed heap grows, it takes Unity longer to mark and collect the memory. As such, you should keep the GC Alloc value at zero while your application runs to prevent the garbage collector from affecting your framerate, as well as keeping the overall heap size small. For more details about the managed heap see the Understanding Automatic Memory Management documentation. |
| Time ms | The total amount of time spent on a particular function in milliseconds. This information might be misleading, as it only contains the time spent on the main thread. If your application uses the Job System or multithreaded rendering, you should be aware of this. |
| Self ms | The total amount of time spent on a particular function in milliseconds, excluding the time Unity spends calling sub-functions. |
| Warning | Indicated by a warning icon, this displays how many times a warning has been triggered during the current frame. For more information see the Performance warnings section of this documentation. |
You can also get more information about where your application calls and uses the profiled functions by selecting either Show Related Objects or Show Calls view from the Details dropdown at the top right hand corner of the module details pane.
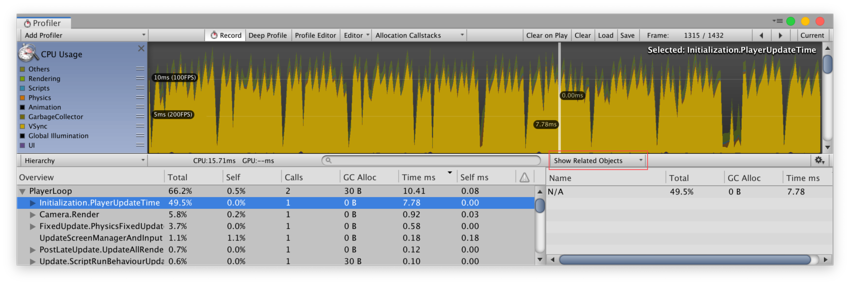
The Show Related Objects view displays a list of UnityEngine.Objects that are associated with the Profiler sample, using the Begin() overload that takes a UnityEngine.Object. Some samples Unity reports have these associations built in, such as Camera.Render samples that are linked to the Camera object that does the rendering. These objects are reported via their instance ID and resolved to a name in the Profiler window.
When you click on one of these objects, Unity tries to find the object via the scene hierarchy and ping it. Because the association uses the instance ID, pinging only works when you are profiling your application the Editor, and for as long as the object still exists.
For GC.Alloc samples, this view displays a list of “N/A” items, one for each allocation that occured at this hierarchy level, with the size of the allocation listed in the GC.Alloc column. If you profile your application in the Editor with the Allocation Callstacks setting enabled, when you select a GC.Alloc sample in this view, the call stack for the allocated scripting object you selected is displayed, even if you did not enable the Deep Profiling setting. For more information, see the Allocation Callstacks section of this documentation.
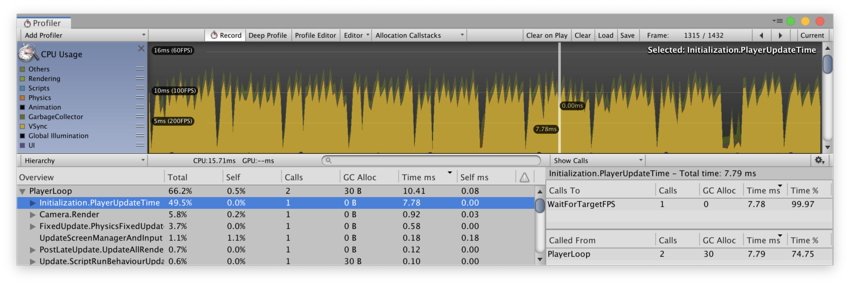
The Show Calls panel displays where the selected sample is being called from as well as what other functions it calls to.
Additionally, under the gear icon at the top of the module details pane, you can enable or disable the Collapse Editor Only Samples setting. This collapses all samples in the Player Loop that only happen because of Editor-only safety checks. When the samples are collapsed, their GC.Alloc value does not contribute to GC.Alloc value of their enclosing sample. This setting is enabled by default. For more information, see the Editor only samples section of this documentation.
Common samples
As well as samples that your scripting code generates, Unity provides a large amount of samples that give you some insight into what is taking up time in your application. The following tables explain what some of the more common samples do.
Main thread base samples
The main thread base samples provide a clear separation between the time spent on your application and time spent on the Editor and Profiler activities. The Recorder can also use these samples to get the timing of a frame on the main thread.
| Sample | Функция: |
|---|---|
| PlayerLoop | The root to any samples that originate from your application’s main loop. When you enable the Profile Editor setting while the Player is running in the Editor in active playmode, this sample nests under the EditorLoop. |
| EditorLoop | The root to any samples that originate from the Editor’s main loop. This is only present while you profile a player in the Editor. When you disable the Profile Editor setting, this sample shows how much time of the frame was spent rendering and running the Editor that contains the Player. |
| Profiler.CollectEditorStats | The root for any samples that relate to collecting stats for different active Profiler modules. Any sample under the child sample Profiler.CollectGlobalStats incurs an overhead on the Player. All other child samples only affect the Editor. To turn specific modules off, close their chart or call Profiler.SetAreaEnabled(). |
Script update samples
Unless you are using the Job System, most of your scripting code is nested underneath the following samples:
| Sample | Функция: |
|---|---|
| Update.ScriptRunBehaviourUpdate | This sample includes calls to MonoBehaviour.Update and processing of coroutines. |
| BehaviourUpdate | This sample processes all Update() methods. |
| CoroutinesDelayedCalls | Contains coroutine samples after their first yield. |
| PreLateUpdate.ScriptRunBehaviourLateUpdate | This sample processes all LateUpdate() methods. |
| FixedBehaviourUpdate | This sample processes all FixedUpdate() methods. |
Rendering and VSync samples
These samples show where the CPU spends time processing data for the GPU or where it might be waiting for the GPU to finish. If the GPU Profiler is not available or it is adding too much overhead, the toolbar does not show this information. These samples can give you an idea of if you are CPU-bound or GPU-bound.
| Sample | Функция: |
|---|---|
| WaitForTargetFPS | The time your application spends waiting for the targeted FPS that Application.targetFrameRate specifies. If this sample is a sub-sample of Gfx.WaitForPresent, it represents the amount of time your application spends waiting for the VSync configured in QualitySettings.vSyncCount. Note: The Editor doesn’t VSync on the GPU and instead uses WaitForTargetFPS to simulate the delay for VSync. Some platforms, in particular Android and iOS, enforce VSync or have a default frame rate cap of 30 or 60. |
| Gfx.ProcessCommands | Contains all processing of the rendering commands on the render thread. Some of that time might be spent waiting for VSync or new commands from the main thread, which you can see from it’s child sample Gfx.WaitForPresent. |
| Gfx.WaitForCommands | Indicates that the render thread is ready for new commands and might indicate a bottle neck on the main thread. |
| Gfx.PresentFrame | Indicates the time your application spends waiting for the GPU to render and present the frame, which might include waiting for VSync. A WaitForTargetFPS sample on the main thread shows how much of that time is spent waiting for VSync. |
| Gfx.WaitForPresent | Indicates that the main thread is ready to start rendering the next frame, but the render thread has not finished waiting on the GPU to present the frame. This might indicate that your application is GPU-bound. To see what the render thread is simultaneously spending time on, check the Timeline view. If the render thread spends time in Camera.Render, your application is CPU-bound and might be spending too much time sending draw calls or textures to the GPU. If the render thread spends time in Gfx.PresentFrame, your game is GPU-bound or it might be waiting for VSync on the GPU. A WaitForTargetFPS sub-sample of GFX.WaitForPresent indicates the portion of the Present phase that your application spends waiting for VSync. |
Physics samples
The following table outlines some of the high-level physics Profiler samples. FixedUpdate calls all of these samples.
| Sample | Функция: | |
|---|---|---|
| Physics.Simulate | Updates the state of the current physics by instructing the physics engine (PhysX) to run its simulation. | |
| Physics.Processing | Processes all non-cloth physics jobs. Expand this sample to show the low-level detail of the work done internally in the physics engine. | |
| Physics.ProcessingCloth | Processes all cloth physics jobs. Expand this sample to show the low-level detail of the work done internally in the physics engine. | |
| Physics.FetchResults | Collects the results of the physics simulation from the physics engine. | |
| Physics.UpdateBodies | Updates all the physics bodies’ positions and rotations. This sample also contains messages that communicate when these updates are sent. | |
| Physics.ProcessReports | Runs once the physics FixedUpdate ends. Processes the various stages of responding to the results of the simulation. Contacts, joint breaks and triggers update and message in this sample. There are four distinct sub stages: | |
| Physics.TriggerEnterExits | Processes OnTriggerEnter and OnTriggerExit events. | |
| Physics.TriggerStays | Processes OnTriggerStay events. | |
| Physics.Contacts | Processes OnCollisionEnter, OnCollisionExit, and OnCollisionStay events. | |
| Physics.JointBreaks | Processes updates and messages relating to broken joints. | |
| Physics.UpdateCloth | Contains updates relating to cloth and their skinned meshes. | |
| Physics.Interpolation | Manages the interpolation of positions and rotations for all the physics objects. | |
Performance warnings
The CPU Profiler can detect some common performance issues and warn you about them. These appear in the Warning column of the Hierarchy view in the module details pane.
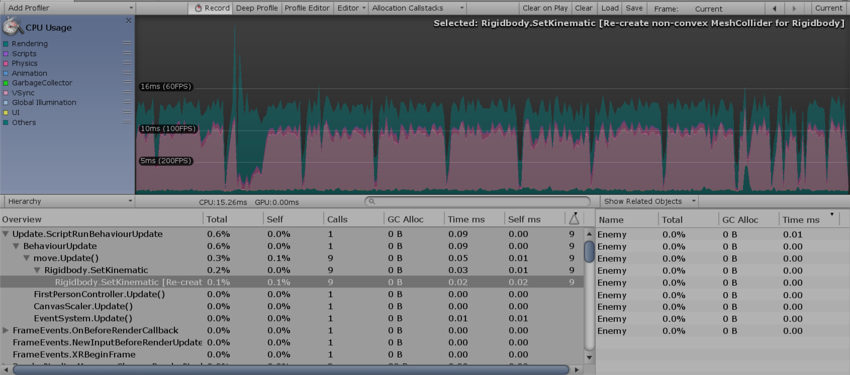
The specific issues the Profiler can detect are:
- Rigidbody.SetKinematic: recreate non-convex MeshCollider for Rigidbody
- Animation.DestroyAnimationClip: triggers RebuildInternalState
- Animation.AddClip: triggers RebuildInternalState
- Animation.RemoveClip: triggers RebuildInternalState
- Animation.Clone: triggers RebuildInternalState
- Animation.Deactivate: triggers RebuildInternalState
Allocation Callstacks
If you profile your application in the Editor, you can see the full call stack for a GC.Alloc sample. To do this, enable the Managed Allocations setting in the Allocation Callstacks dropdown of the toolbar of the Profiler window. In the frames you profile after you turn this option on, the GC.Alloc samples contain their callstacks.
Every scripting heap allocation shows up as a GC.Alloc sample in both the Hierarchy view and Timeline view. In Timeline view, it is colored bright magenta. To see a call stack, select the CPU Profiler Module and select a GC.Alloc sample in Timeline view. The call stack appears in the selection highlight.
Alternatively you can see the call stack in Hierarchy or Raw Hierarchy view. Set the Details view to Show Related Objects. Because GC.Alloc samples have no name, they show up as N/A in this panel. When you select an N/A object, the call stack is displayed in the bottom half of the Details view.
For more information about managed allocations, see documentation on Understanding Automatic Memory Management.
Editor only samples
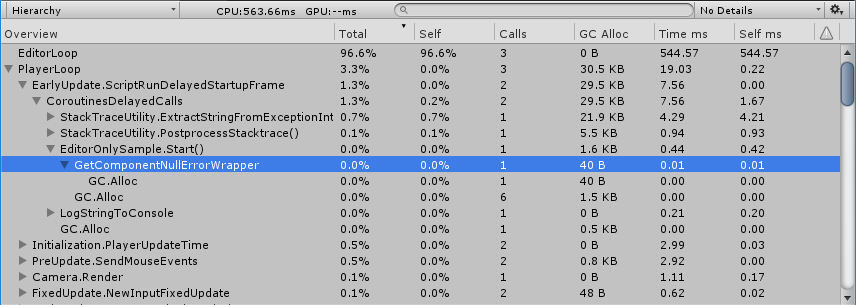
Some samples are only present when you are profiling in the Editor. This includes security checks like the GetComponentNullErrorWrapper, which helps to identify a null component usage; CheckConsistency, which validates object setup; CheckAllowDestructionRecursive, which is a destruction check; and Prefab-related activities. All of these samples are not present in the Player.

By default, Editor-only samples are collapsed in the Hierarchy view, and are named EditorOnly [SampleName]. While they might cause GC.Alloc, they do not contribute to the GC.Alloc value of their enclosing sample if they are collapsed.
To change the default behavior, click the gear icon in the top right of the module details pane and disable the Collapse EditorOnly Samples option. When you do this, you can expand the sample and contribute its GC.Alloc value to the enclosing sample.
This option does not affect the Timeline view. These samples can usually be ignored and are a prompt to profile Player builds on target devices to find actual issues.
Copyright © 2023 Unity Technologies
优美缔软件(上海)有限公司 版权所有
"Unity"、Unity 徽标及其他 Unity 商标是 Unity Technologies 或其附属机构在美国及其他地区的商标或注册商标。其他名称或品牌是其各自所有者的商标。
公安部备案号:
31010902002961