Profiling
When discussing performance, it is vital to remember that all optimization attempts must start with a discovery process. Profiling an application to discover its hotspots is the necessary first step, followed by an analysis of profiling results against the project’s technical and Asset architecture.
Note: Where this section discusses method names found in native-code profiling traces, the method names have been drawn from Unity 5.3. Method names may change in future versions of Unity.
Tools
For profiling, there are many different tools available to Unity developers. Unity has a suite of built-in tools, such as the CPU Profiler, Memory Profiler and the new 5.3 Memory Analyzer.
However, the best data generally comes from platform-specific tools. These include:
For iOS: Instruments and the XCode Frame Debugger
For Android: the Snapdragon Profiler
For platforms running Intel CPUs/GPUs: VTune and Intel GPA
For PS4: the Razor suite and VR Trace
For Xbox: the Pix tool
These tools generally have the most utility on platforms that can utilize IL2CPP to produce a C++ version of the project. These native-code versions provide transparent callstacks and high-resolution method timings that are unavailable when running under Mono.
Unity has already created a basic guide to using Instruments to profile iOS games; see Profiling with Instruments.
Dissecting startup traces
When looking at a trace of start-up times, there are two key methods to inspect. These two methods are the primary places where the configuration, Assets and code of a project can impact start-up time.
Note that start-up time manifests differently on different platforms. On most platforms it is visible to the user as a static splash screen.
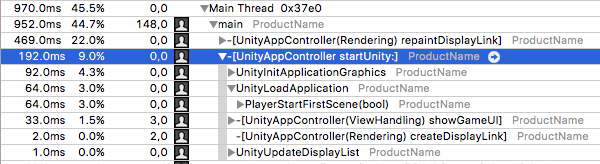
The above screenshot is from an Instruments trace of an example project running on an iOS device. Within the platform-specific startUnity method, note the UnityInitApplicationGraphics and UnityLoadApplication methods.
UnityInitApplicationGraphics performs a lot of internal work, such as setting up the graphics device and initializing many of Unity’s internal systems. In addition, it initializes the Resources system. To do this, it must load an index of all of the files contained by the Resources system.
Every Asset file within every folder named “Resources” (1) (NOTE: This only applies to folders named “Resources” that are within the project’s “Assets” folder, as well as all child folders within those “Resources” folders.) is included in the Resource system’s data. Therefore, the time required to initialize the Resources system increases at least linearly in correlation with the number of files within “Resources” folders.
UnityLoadApplication contains methods that load and initialize the first Scene in the project. This includes deserializing and instantiating all of the data necessary to display the first Scene, such as compiling Shaders, uploading Textures and instantiating GameObjects. Additionally, all MonoBehaviours in the first Scene have their Awake callbacks executed at this time.
These processes mean that if there is any long-running code in an Awake callback in the first Scene of a project, that code could be responsible for slowing down the project’s initial start-up time. Resolving this involves either eliminating the slow code, or executing it elsewhere in the application’s lifecycle.
Dissecting run time traces
For profiling traces captured after initial startup time, the primary place of interest is the method PlayerLoop. This is Unity’s main loop, and the code within it runs once per frame.
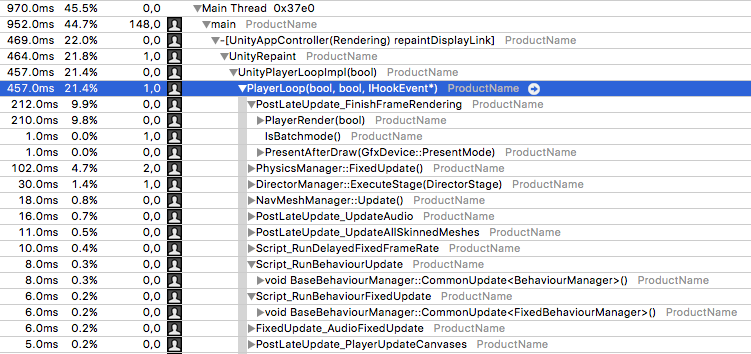
The above screenshot is from a profiling run of an example Unity 5.4 project, and illustrates several of the most interesting methods within PlayerLoop. Note that the names of methods within the PlayerLoop may vary between Unity versions.
PlayerRender is the method that runs Unity’s rendering system. This includes culling objects, calculating dynamic batches, and submitting drawing instructions to the GPU. Any Image Effects or rendering-based script callbacks (OnWillRenderObject, for example) also run here. In general, this should be the top consumer of CPU time while the project is interactive.
BaseBehaviourManager calls three templated versions of CommonUpdate. These invoke certain callbacks within MonoBehaviours attached to active GameObjects in the current Scene.
CommonUpdate<UpdateManager>callsUpdatecallbacksCommonUpdate<LateUpdateManager>callsLateUpdatecallbacksCommonUpdate<FixedUpdateManager>callsFixedUpdateif the physics system has ticked
In general, BaseBehaviourManager::CommonUpdate<UpdateManager> is the most interesting method family to inspect, because it is the entry point for most of the script code running within a Unity project.
There are several other methods of interest:
UI::CanvasManager invokes several different callbacks if a project uses Unity UI. This includes Unity UI’s batch computation and layout updates; the two operations that most often cause CanvasManager to appear in the profiler.
DelayedCallManager::Update runs coroutines. These are covered in more detail in the “Coroutines” chapter of this document.
PhysicsManager::FixedUpdate runs the PhysX physics system. This primarily involves running PhysX’s internal code, and is influenced by the number of physics objects in the current Scene, such as Rigidbodies and Colliders. However, physics-based callbacks also appear here – in particular, OnTriggerStay and OnCollisionStay.
If the project is using 2D physics, that appears as an analogous set of calls under Physics2DManager::FixedUpdate.
Dissecting a script method
When scripts are invoked on platforms cross-compiled with IL2CPP, look for trace lines containing a ScriptingInvocation object. This is the point where Unity’s internal native code is transitioning into the script runtime in order to execute script code (2) (NOTE:
Technically, after being run through IL2CPP, C#/JS script code also becomes native code. However, this cross-compiled code primarily executes methods via the IL2CPP runtime framework and does not closely resemble handwritten C++.).
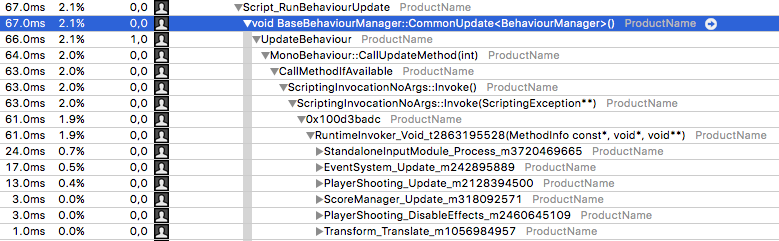
The above screenshot is from another trace from an example project running in Unity 5.4. All of the methods nested beneath the RuntimeInvoker_Void line are part of cross-compiled C# scripts that are being executed once per frame.
The trace lines are fairly easy to read: each one is the name of the original class followed by an underscore and the name of the original method. In this example trace, it’s possible to see EventSystem.Update, PlayerShooting.Update and several other Update methods. These are the standard Unity Update callbacks found in most MonoBehaviours.
By expanding these methods, it is possible to discover exactly which methods within them are consuming CPU time. This includes other script methods within the project, Unity APIs and C# library code.
The above trace shows that the StandaloneInputModule.Process method is raycasting through the entire UI once per frame, in order to detect whether any touch events are hovering over or activating any UI elements. The primary cost is iterating over all the UI elements, and testing whether the mouse’s position is within their bounding rectangle.
Asset loading
Asset loading can also be identified in CPU traces. The main method indicating an Asset load is SerializedFile::ReadObject. This method connects a binary data stream (from a file) to Unity’s serialization system, which operates via a method named Transfer. The Transfer method can be found on all Asset types, such as Textures, MonoBehaviours and Particle Systems.
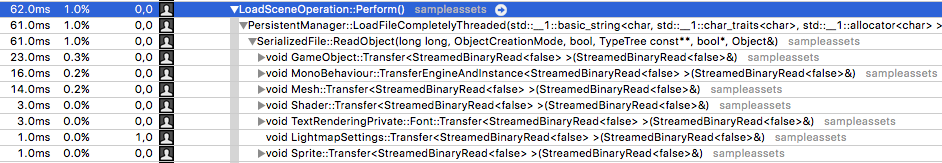
In the above screenshot, a Scene is being loaded. This requires Unity to read and deserialize all the Assets within the Scene, as denoted by the calls to various Transfer methods beneath SerializedFile::ReadObject.
In general, if a performance stutter is seen during runtime and a performance trace shows significant time being used by SerializedFile::ReadObject, the framerate is being reduced due to Asset loads. Note that, in most cases, SerializedFile::ReadObject can be found on the main thread only when synchronous Asset loads are requested via the SceneManager, Resources or AssetBundle APIs.
This sort of performance stutter can be remediated in the usual ways: you can make Asset loading asynchronous (which moves the heavy ReadObject call to a worker thread), or preload certain heavy Assets.
Note that Transfer calls also appear when cloning objects (denoted by the CloneObject method in a trace). If a call to Transfer appears beneath a CloneObject call, then the Asset is not being loaded from storage. Instead, the old Object’s data is being transferred to the new Object. To do this, Unity serializes the old Object and deserializes the resulting data as the new Object.
Footnotes
- (1) This only applies to folders named Resources that are within the project’s Assets folder, as well as all child folders within those Resources folders.
- (2) Technically, after being run through IL2CPP, C#/JS script code also becomes native code. However, this cross-compiled code primarily executes methods via the IL2CPP runtime framework and does not closely resemble handwritten C++.
- 2018–04–25 Page amended with limited editorial review
Copyright © 2023 Unity Technologies
优美缔软件(上海)有限公司 版权所有
"Unity"、Unity 徽标及其他 Unity 商标是 Unity Technologies 或其附属机构在美国及其他地区的商标或注册商标。其他名称或品牌是其各自所有者的商标。
公安部备案号:
31010902002961