Memory Profiler 模块增强
增加 AssetBundle 内存统计
由于小游戏平台没有真实的文件系统,加载 AssetBundle 时往往会带来 AB 文件大小 2–3 倍的开销。因此我们添加了 AssetBundle 内存统计,便于查看各个 AB 内存占用情况,用于分析 AB 加载逻辑是否合理。
- 使用该功能需要 从PackageManager中卸载package:
"com.unity.memoryprofiler" - 通过 Window -> Analysis -> Profiler 即可查看 Memory Profiler 模块。
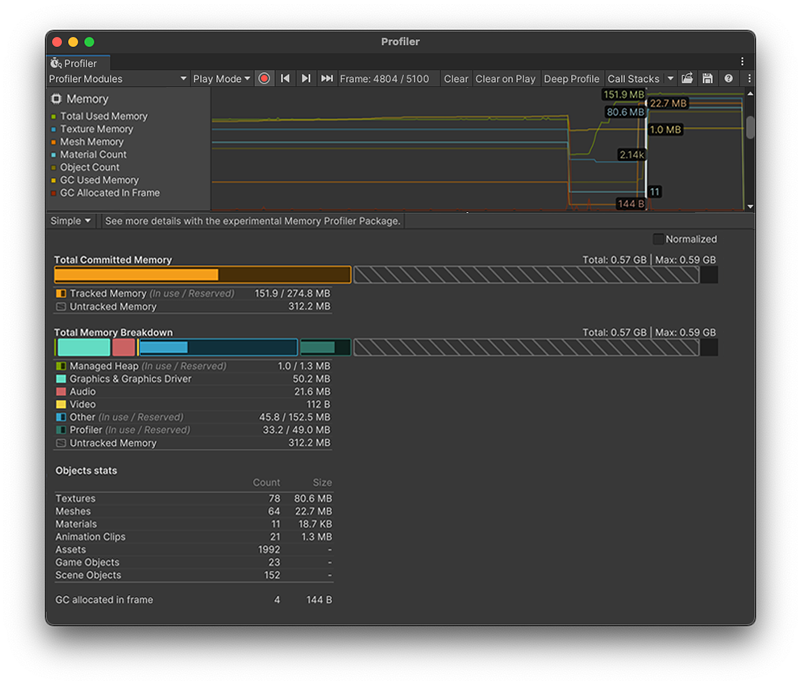
Memory Profiler 模块
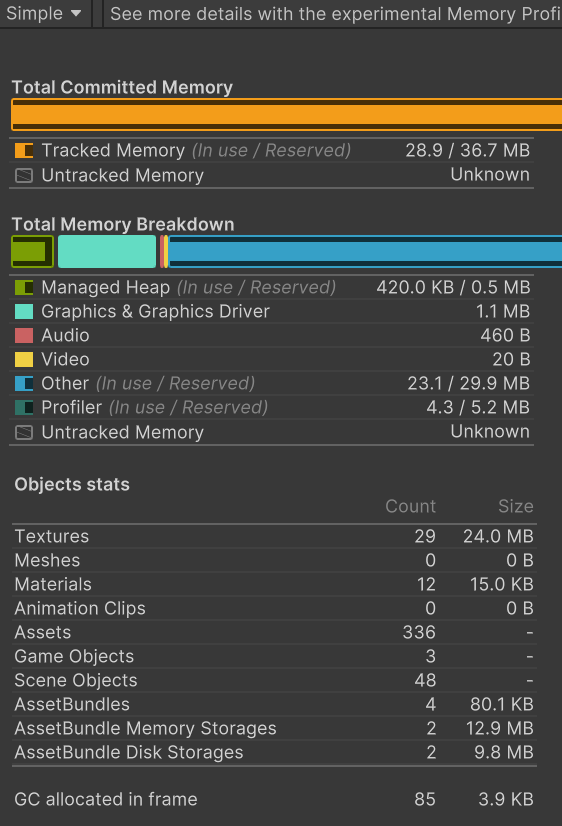
Simple View - Object Stats下增加以下统计:
AssetBundles:内存中 AssetBundle Object 对象本身占用内存
AssetBundle Memory Storages:AssetBundle 文件缓存(解压后)在 C++ native heap 中占用的内存
AssetBundle Disk Storage:Emscripten JS 文件系统中 AssetBundle 文件占用内存
ProfilerRecorder 接口
ProfilerRecorder 新增如下接口,可以从代码中获取以下6项 AB 内存使用情况:
AssetBundle CountAssetBundle Bytes(仅 development 版本可用)AssetBundle Memory Storage CountAssetBundle Memory Storage BytesAssetBundle Disk Storage CountAssetBundle Disk Storage Bytes
以上为内置 Memory Profiler 模块的信息。有关 Memory Profiler 包的更多信息,请参阅 Memory Profiler 文档。